 Download our 2024 Capital Market Assumptions Report.
Our forward-looking assumptions are the key input variables for our asset allocation work on behalf of clients.
Each year, though make incremental enhancements to our methods for gauging the future value of assets, we maintain our focus on the primary, reliable drivers of risk and return. Our assumptions are anchored in the empirical facts presented by long-term capital markets rather than speculative observations on recent market conditions. We avoid unnecessary complexity, preferring instead to rely upon transparent strategies that work reliably. Our analysis is comprehensive, but not complicated — because we are convinced that the most robust solutions have no hidden constraints and few moving parts. These same principles – pragmatic research and simplicity in execution – guide all of our work for clients.
Presented in nominal annual arithmetic average terms, our current capital market assumptions are depicted in the following chart:
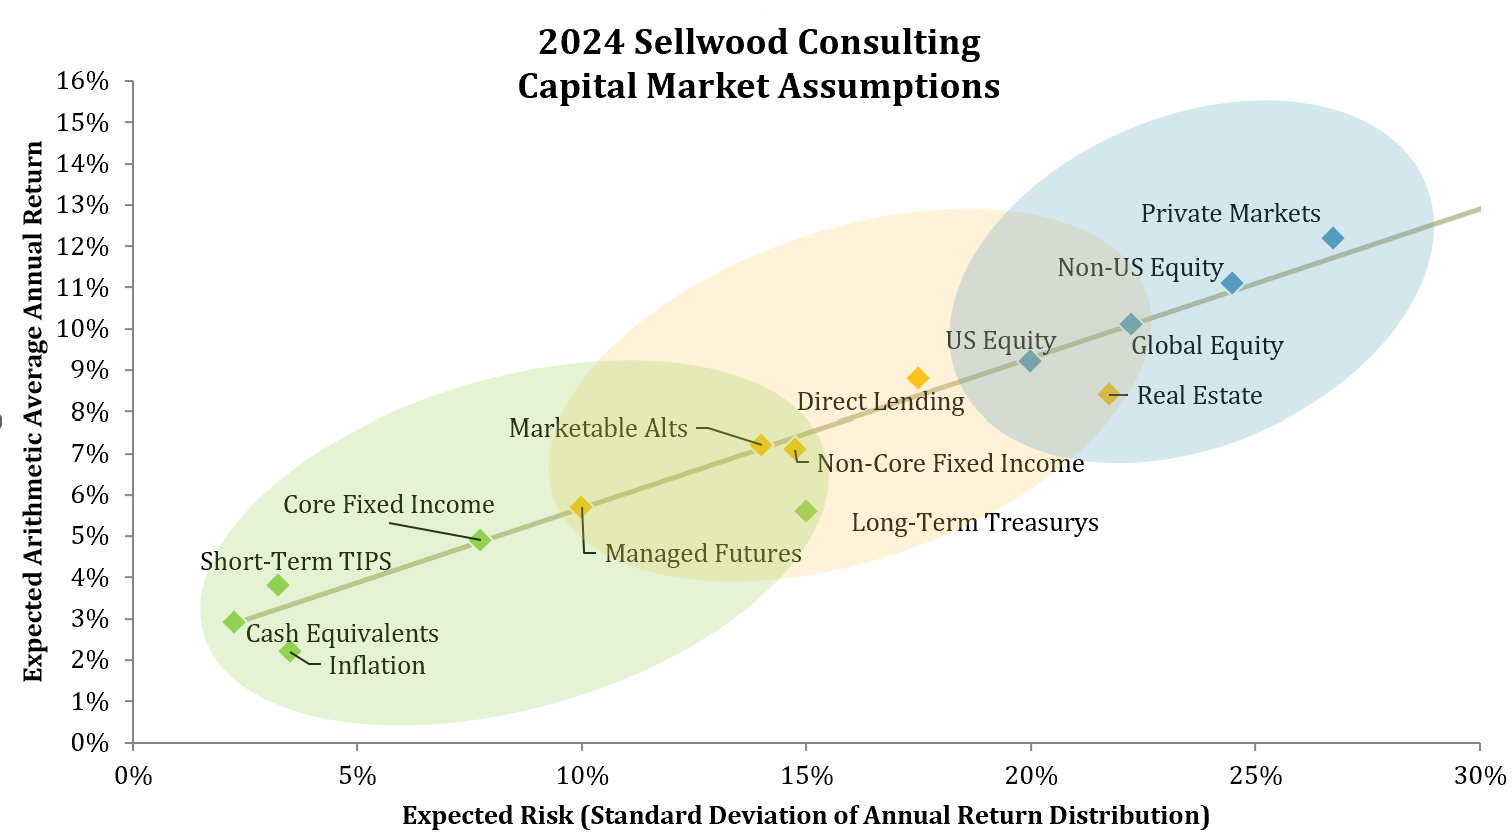
Sellwood Consulting updates these capital markets assumptions annually. Our assumptions are forward-looking in nature and reflect a ten-year investment horizon.
Research Report
This report documents our process for creating these capital markets assumptions, and we provide detailed methodology for each. You may download a PDF of the report.
Principles
Several over-arching principles inform all of our analysis regarding forward-looking capital market assumptions:
- We believe that forward-looking capital market assumptions are an important, but far from the only important, input for properly constructing portfolios. Great care should be taken not to rely only on mean-variance analysis when constructing portfolios. An analysis that relies only on mean-variance analysis will over-allocate to assets with infinitesimally superior risk/return estimates, and assets that are less liquid or less frequently priced, resulting in inferior diversification and the assumption of unintended risks.
- Our assumptions are forward-looking in nature and reflect a ten-year horizon. They are most appropriate for analysis of portfolios with long-term (10 year or greater) horizons. For portfolios with shorter horizons, alternate methods of analysis should be employed.
- We deliberately use different methods to separately estimate return and risk. The first part of this paper explains the different methods we employ to estimate the future return of each individual asset class. Later in the paper, we explain a more standardized approach to estimating future risk of the same asset classes.
- Our return assumptions utilize a build-up approach based on the current values of the individual drivers of expected return that are unique to each asset class.
- For asset classes where the market provides a current view of forward-looking returns, our assumptions reflect the market view. Additional complexity would be unhelpful.
- Where possible, all of our return assumptions incorporate current valuations.
- Our assumptions are for a single-year analysis period. The returns are average one-year returns, and the standard deviation of returns is the standard deviation of one-year returns.
- Our assumptions are presented in nominal terms. Where we have used historical returns in our input analysis, we have always transformed them to real, after-inflation, returns, to strip out the influence of historical inflation. At the end of the build-up process, where appropriate, we add the market’s current measure of forward-looking inflation back to the assumptions to create forward-looking nominal return assumptions.
- We calculate compound average annual returns. After calculating a compound return and a risk assumption, we combine the two mathematically to calculate an arithmetic average expected return, which is a necessary input for mean-variance analysis.
- Our assumptions are passive in nature and assume no active management.
- Our approach to modeling the expected risk of each asset category is multi-faceted and reflects the fact that risky assets exhibit “fat tails” that are not present in normal distributions. First, we examine the historical standard deviation of the returns for a proxy index for the asset category (both the full history and most recent 10 years). Next, we examine the historical worst-case annual return experience (or in the case of asset categories that are not priced to market, the worst two years) for the asset class. If necessary, we adjust our risk estimates upward to ensure that the actual worst-case experience had at least a 1% probability of occurring (once every 100 years) under our assumed return and risk distribution parameters. Finally, for asset classes where our confidence in the data available for examination is limited, we qualitatively adjust our risk assumption to reflect this uncertainty.
- Our correlation coefficient assumptions are mostly derived from history, with an emphasis on the recent past. We seek a proxy for each asset category we have modeled with as long a history as possible, and then calculate our correlation assumptions using a simple average of the following, for each pair of asset categories: Longest-term correlation, 10-year correlation, 5-year correlation, and 3-year correlation. This approach overweights the recent past, while acknowledging the long-term past. It is also a more conservative measure for diversification benefit to a portfolio, because recent correlations have been higher than they have been historically.
- We round our assumptions to the nearest 10 basis points, in the case of arithmetic average return, and nearest 25 basis points, in the case of risk.
- Our assumptions are applicable to US-based, non-taxable investors. For taxable clients located in the United States, we maintain a separate methodology that considers the effects of taxes on expected returns and risk.
- We purposefully design a limited set of mostly non-overlapping assumptions for major asset categories. By focusing on major asset classes, with the most data available for examination, we can develop the most robust assumptions. Asset allocation analysis is a blunt tool, and we believe that input assumptions should not be more granular than the methodology can support. Using a more limited set of assumptions reduces the risk of false precision when implementing them.
- We strive to construct a set of assumptions that is straightforward, explainable, fully documented, and replicable by other researchers. Our assumptions are as complex as necessary but no more complex than necessary. They have no hidden constraints. We could make them more complicated, but we do not believe that doing so would make them better.
Past Assumptions
We believe in full transparency, and in exposing our research to scrutiny. All of Sellwood’s capital market assumptions, past and present, can be found here:
- 2024 Capital Market Assumptions
- 2023 Capital Market Assumptions
- 2022 Capital Market Assumptions
- 2021 Capital Market Assumptions
- 2020 Capital Market Assumptions
- 2019 Capital Market Assumptions
- 2018 Capital Market Assumptions
- 2017 Capital Market Assumptions
- 2016 Capital Market Assumptions
- 2015 Capital Market Assumptions
- 2014 Capital Market Assumptions
- 2013 Capital Market Assumptions
2023 Capital Market Assumptions by Sellwood Consulting LLC is licensed under a Creative Commons Attribution-NoDerivatives 4.0 International License.