It was five years ago yesterday – March 9, 2009 – that the US stock market tumbled to its lowest point in the 2008/09 market crash. The five years that followed have seen a tremendous reinflation of asset values for risky assets.
| Asset Class | 5-Year Cumulative Return (Since March 9, 2009) |
|---|---|
| US Micro-Cap Stocks (Russell Microcap) | 293% |
| US REITs (MSCI US REIT) | 292% |
| US Small-Cap Stocks (Russell 2000) | 267% |
| US Large-Cap Stocks (S&P 500) | 206% |
| Non-US Stocks (MSCI AC World ex US) | 137% |
Returns to taking risk have been superb since the market’s 2009 lows, and as investors we are thankful for them. But to determine how much risk is appropriate in portfolios, as usual, we are guided by the lessons of history.
The following chart depicts rolling five-year returns for the S&P 500 Index, back to 19151. Each point along the brown line represents the total return over the five years preceding that date. (click to enlarge)
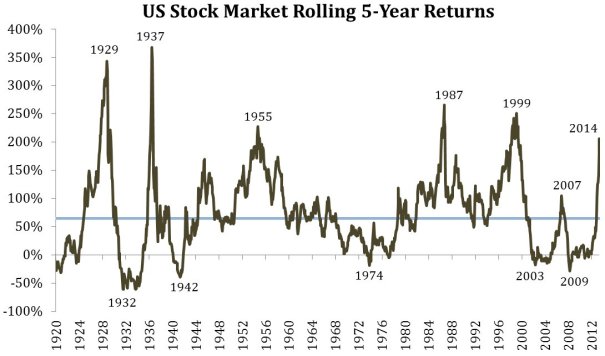
The average five-year cumulative return, at 65%, is depicted by the horizontal line.
We draw several inferences from this chart:
- The five-year return we have just experienced is roughly three times the magnitude of the average of all five-year periods.
- Historically speaking, while periods of low return sometimes persist, and periods of average return sometimes persist, periods of very high return rarely persist. With two notable exceptions following the end of World War II and during the late-nineties technology bubble, periods of elevated return have quickly reversed.
- In every case where five-year return has peaked, it has been followed, sooner or later, by a period of five-year returns below the average before peaking again.
We do not believe in short-term forecasting, and far be it from us to call this a stock market peak. We believe that the appropriate response to the last five years of market returns is to be grateful but cautious.
So happy anniversary, bull market! We can only hope you’re not too exhausted to enjoy a party.
1 Note: US Stock Market Returns are represented by price return for the Dow Jones Industrial Average until January 1926 and total return for the S&P 500 Index (Ibbotson Extended) thereafter.