
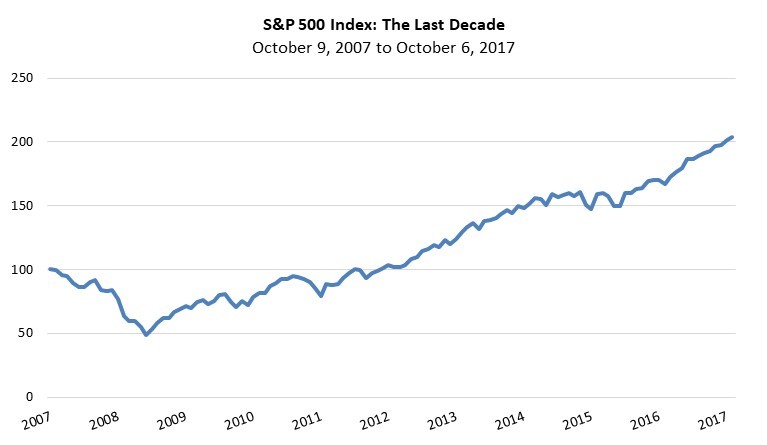
Today marks the 10th anniversary of the birth, or at least the conception, of the Global Financial Crisis. The US equity market peaked, before the Global Financial Crisis began, on October 9, 2007.
In the ten years since then, we have witnessed the following annualized market returns:
- US Large-Cap Stocks (S&P 500): 7.4%
- US Small-Cap Stocks (Russell 2000): 7.5%
- Non-US Equities (MSCI ACWI ex US, USD): 1.2%
- US Bonds (Lehman/Barclays/Bloomberg Aggregate): 4.3%
- Cash (3-Month Treasury Bills): 0.5%
- Inflation: 1.6%
Leaving non-US equities aside, it’s been a pretty normal decade for capital markets.
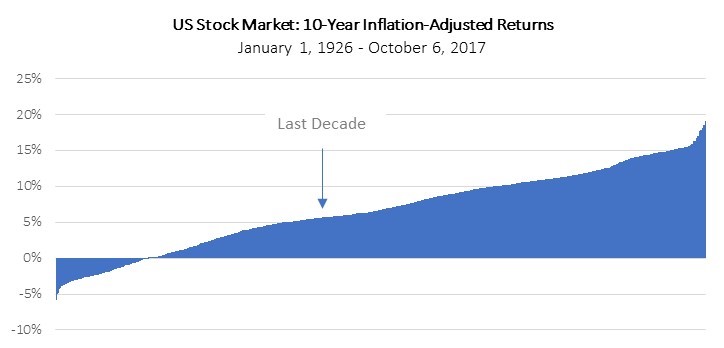
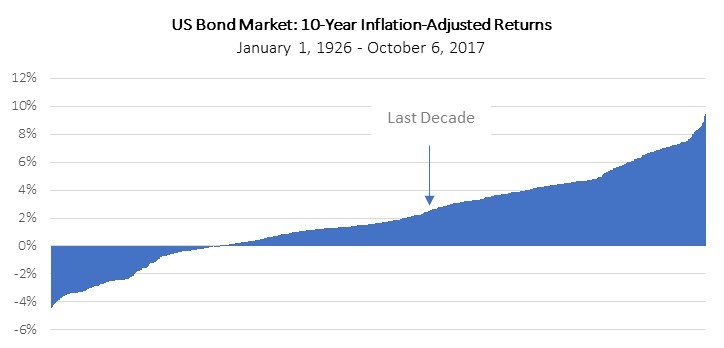
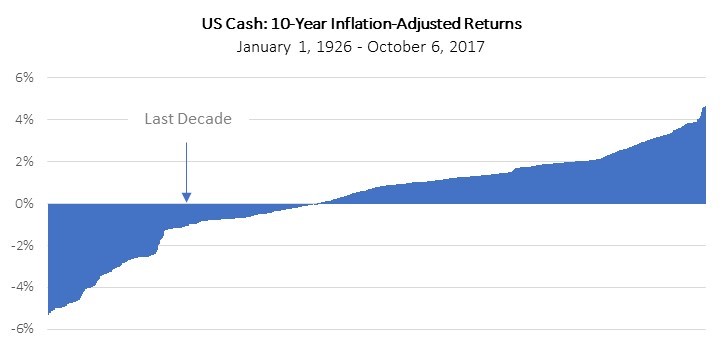
Measured monthly, there have been 982 ten-year periods since 1926, which is as far back as we have reliable data for the US market. We can compare the return experience of the last ten years to all of those ten-year periods to place the most recent decade into historical context. Adjusted for inflation, US stocks performed only a bit worse than their long-term median in the last ten years. Their return in the last decade ranks in the 58th percentile amongst all 982 historical ten-year periods – better than about 40% of the decades they have experienced, and worse than about 60% of them. In the most recent decade, US bonds ranked in the 41st percentile – also near the middle of their historical distribution, but a bit better than their historical median. Cash fared a bit worse, outperforming only 21% of historical periods.
Data source: the Ibbotson/Dimson, Marsh, Staunton (SBBI) data set, via Morningstar.
In a decade that included the Global Financial Crisis (and an unprecedented policy response), US stocks and cash each underperformed the median of their own historical 10-year experiences by approximately one percentage point per year, while US investment-grade bonds outperformed their own historical median by approximately one percentage point per year, after adjusting for inflation. The market experience of the last decade was no outlier – it was normal, close to median for both stocks and bonds. And sub-par performance from one major asset category, stocks, was offset by superior performance by another, bonds, illustrating the time-tested value of diversification.
The last decade was a relatively normal one, from a returns perspective.
“Normal” Sure Didn’t Feel Like It

Of course, the last decade was anything but normal; it only appears that way when comparing the starting point to the end point, and ignoring what happened along the way. Roller coasters are never scary when the coaster rolls to a stop on the flat part of the track, to let the passengers on and off, and the ride is a lot less interesting if you close your eyes during the bumps and rolls.
Consider what we have lived through in the last decade:
- October 9, 2007: The S&P 500 pre-crisis peak of 1,565.15.
- January 2008: Fed reduces short-term rates by 75 bps, and then another 50 bps eight days later.
- February 2008: Economic Stimulus Act of 2008 signed into law.
- March 2008: Bear Stearns collapses; Fed announces $200 billion bank lending program.
- September 2008: Lehman Brothers goes bankrupt; bailout of AIG, Fannie Mae, and Freddie Mac; Washington Mutual and Wachovia fail; Bank of America acquires Merrill Lynch; Reserve money market fund falls below $1 net asset value; SEC bans short selling of financial companies.
- October 2008: $700 billion TARP program; Iceland financial sector collapses.
- November 2008: President Obama elected; Fed announces Quantitative Easing program.
- December: the Federal Reserve lowers short-term interest rates to zero.
- February 2009: $787 billion economic stimulus package.
- March 2009: The Dow Jones Industrial Average had fallen 50% in 17 months.
- April 2009: Swine Flu epidemic.
- May 2010: European sovereign debt crisis begins; EU bailout; Flash Crash: Dow Jones Industrial Average drops 9% within minutes.
- July 2010: Dodd-Frank bill signed into law.
- November 2010: Cholera epidemic.
- August 2011: S&P downgrades the United States.
- 2012: Europe enters “double dip recession”
- January 2013: US government shutdown.
- March 28, 2013: The S&P 500 recovers its prior (October 9, 2007) peak value of 1,565.15.
- May 2013: Fed announces plans to slow pace of asset purchases; markets throw “taper tantrum.”
- December 2013: Detroit files for bankruptcy.
- 2014: Islamic State (ISIS) rises.
- March 2014: Ebola epidemic.
- 2014: US employment surpasses pre-2008 high.
- Second half of 2014: Oil prices decline by 50%.
- January 2015: Swiss central bank abandons peg of the Swiss franc to the euro.
- August 2015: China devalues the yuan; the Dow Jones Industrial Average plunges 1,000 points at market open two weeks later.
- December 2015: European Central Bank announces expanded monetary stimulus.
- December 2015: Federal Reserve finally raises short-term rates above zero.
- January 2016: worst-ever start to a year for the S&P 500 index.
- January 2016: Bank of Japan lowers short-term rates below zero.
- June 2016: Brexit vote.
- November 2016: President Trump elected.
It is said that “markets climb a wall of worry.” There has certainly been a lot to worry about during the last ten years.
The Calendar Matters
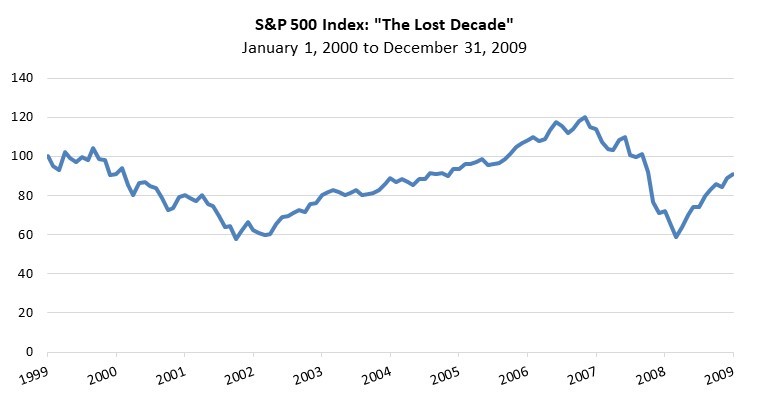
The last time the calendar announced the change of a decade – December 31, 2009 – investors lamented a “lost decade” for US equities. The S&P 500 had recorded a total return over the prior ten years of -9.1%, which represented the worst ten-year period in its history – worse, even, than the during the Great Depression.
But in hindsight, we know that this “lost decade” was merely a quirk of the calendar, measuring ten years that began at the peak of the late-nineties market bubble, which burst three months later, and ending just after the 2008/2009 market crisis, which culminated only nine months prior. The decade represented about one and a half market cycles – from peak (2000) to trough (2002) to peak (2007) to trough (2009):
One and a half market cycles is not an appropriate evaluation horizon for the performance of any asset class. We need one more half cycle to make a proper evaluation. That last half market cycle is the one we are in now.
Time will tell whether October 9, 2017, represents the completion of the current market cycle; the current eight-year equity bull market (the second longest in history) may still have legs. But if today did represent the peak, then the last decade, from October 9, 2007 to October 9, 2017, would represent one full market cycle. Over that full cycle, markets behaved roughly as they always have.
Lessons Learned
Markets are barometers for investor mood, pendulums that swing between greed and fear – sometimes too far in either direction. These swings typically occur over relatively short time periods. The decade from 2000-2009 shows us that timing and valuations, and entry and exit points, into risky assets matter. It also teaches us to be aware of market cycles and to be cautious when extrapolating the past into the future.
Reviewing the last decade teaches us the value of patience, perspective, and humility when investing or examining portfolios. These ten years presented many opportunities to become overly greedy or overly fearful, to attempt to outsmart markets with tactical or market-timing decisions, or to lose faith in the value of a solid, rebalanced, long-term portfolio. Market events feel dramatic, but headlines come and go. When they do, patient, long-term investors are typically rewarded. At the same time, complacency is risky. The last half market cycle has been a long one, but we know it is incomplete.
If, however, we can go through a generational market crisis and still have experienced 10-year returns similar to what history has delivered, we think that’s a pretty good outcome. The last decade was only “lost” to those whose patience, perspective, and humility were lost as well.