
The Treasury yield curve remains persistently inverted, implying that short-term bonds offer higher expected returns than intermediate- or long-term bonds. Given this information, does it make sense for intermediate-term bond investors to seek those higher returns by shortening the duration of their bond portfolios?
A Thought Experiment: Two Ways to Hold Bonds for Five Years
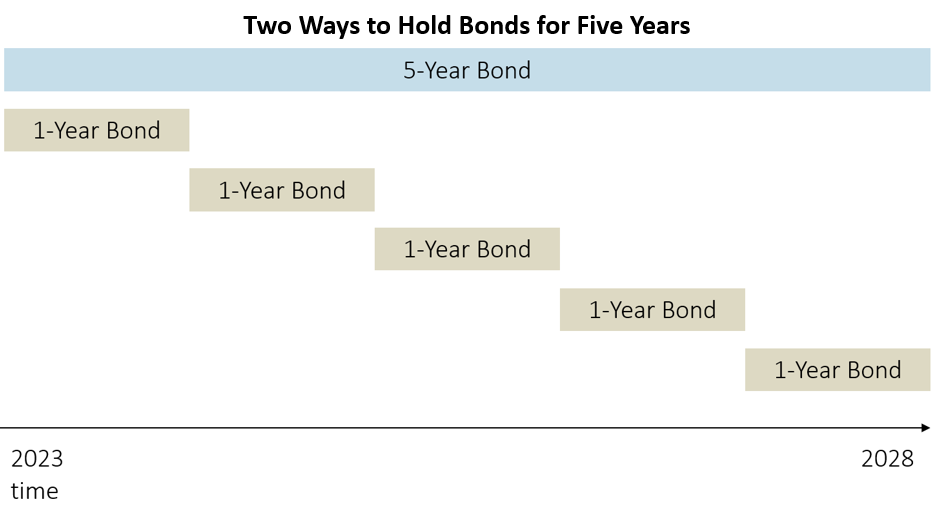
If an investor is going to own bonds for a given investment horizon, there are a number of ways to do it. As a simplified thought experiment, consider a hypothetical investor who plans to hold US Treasury bonds for five years. Over that five-year investment horizon, the investor could hold:
- A single five-year Treasury bond
- Five one-year Treasury bonds, in sequence
- A one-year Treasury bond, and then a four-year Treasury bond
- A two-year Treasury bond, and then a three-year Treasury bond
- etc.
For discussion’s sake, let’s consider two strategies for holding US Treasury bonds for the next five years: purchasing a single 5-year Treasury bond and holding it to maturity, and purchasing five 1-year Treasury bonds in sequence, holding each to maturity and then rolling those proceeds in the next 1-year bond issued a year later.
The current yield curve suggests that returns may be higher from holding a one-year bond instead of the five-year bond. Whereas the 5-year Treasury bond yields only 3.8%, the 1-year Treasury bond yields 5.2% — a 37% premium.
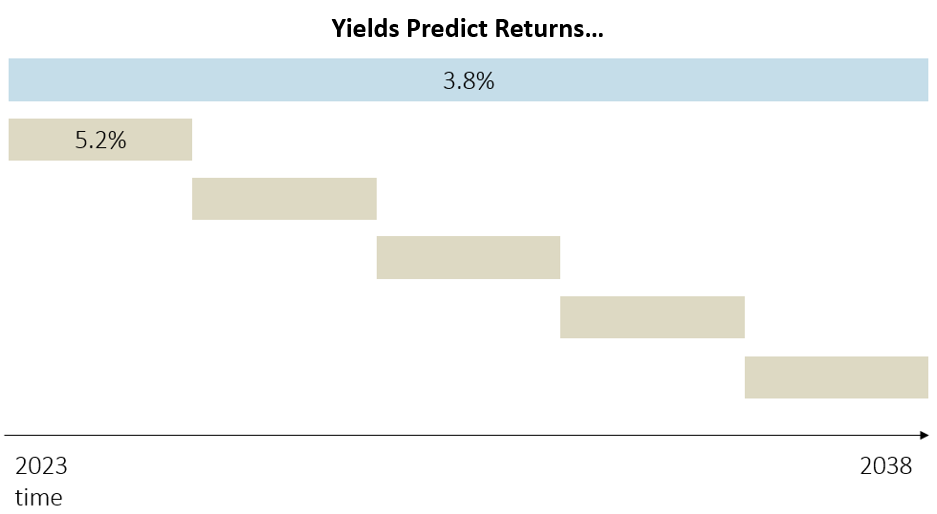
That 5.2% yield represents a 5.2% expected return that is all but certain – but the 5.2% return is guaranteed only for the first year. If our hypothetical investor bought the one-year bond, the investor would face the risk of reinvesting that money when the one-year bond matures one year from now. While we know with certainty what a Treasury bond purchased today will return over its life, the return of a bond that will be issued in the future is much less certain.
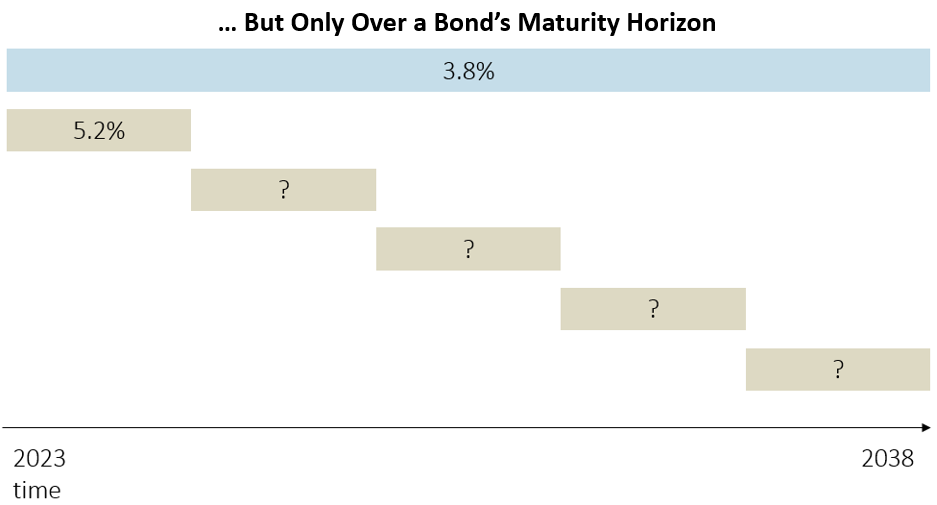
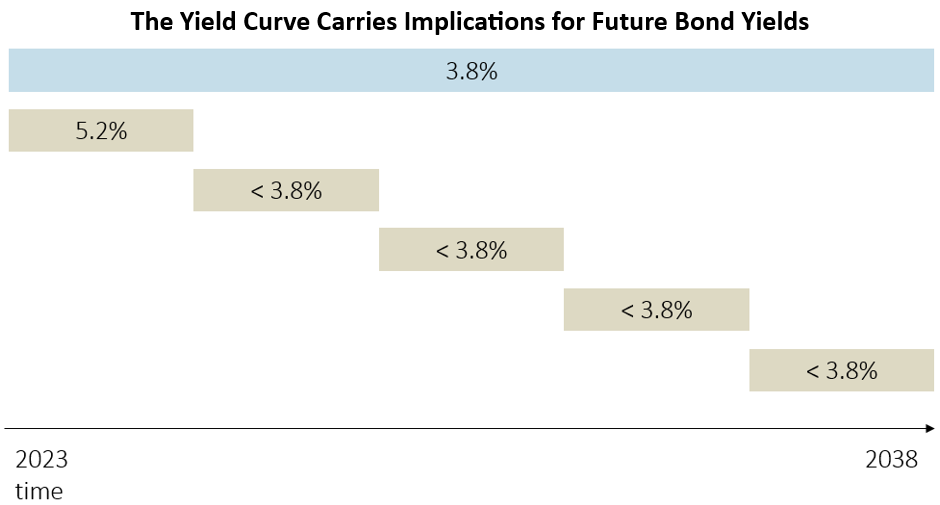
Although the future is uncertain, the yield curve does tell us some information about the future returns of the one-year bonds that will be issued one, two, three, and four years from now. The yield curve’s inversion tells us that they are currently expected to be issued at rates lower than 3.8%.
The market for US Treasury bonds is efficient enough that arbitrage – riskless return – should not be obtainable with the simple strategy of buying five one-year Treasury bonds instead of one five-year Treasury bond. This means that if the first one-year Treasury bond pays a yield higher than the five-year Treasury bond (5.2% vs. 3.8%), then all of the following one-year Treasury bonds must expect to yield less than 3.8% when they are issued in the future.
Of course, the world will change over the next five years, but knowing what we know today, the total expected return over the full five-year period should be very close to 3.8% for both strategies, regardless of which specific strategy of owning Treasury bonds for five years is employed. The actual realized return will be higher for one investment strategy or the other, but we can’t know in advance which one it will be – it depends on future interest rates and investor preferences, both of which are unknowable in advance.
If an investor knows that they will hold bonds for five years, the best thing we can say about preferring one strategy to the other is that they likely expect very similar returns over the full five-year period. To prefer one strategy over the other implies making a forecast of how different future interest rates will be from what the current yield curve– derived from the consensus expectations of all market participants — implies about them. We would never recommend making such forecasts – evidence suggests that even professional interest rate forecasters are notoriously poor at the task.
Over any investment horizon, regardless of the duration of the bonds employed, it is very difficult to hold bonds over the full horizon and escape the starting-point yield for a bond with that same horizon. In other words, if an investor’s holding period for Treasury bonds is five years, the expected return for their Treasury bonds over the next five years is currently very close to 3.8% per year, regardless of whether the first bond they own yields 5.2%, 3.8%, or something else.
But all of this analysis is incomplete without considering two additional relevant considerations when designing a bond portfolio: the term premium, and the diversification properties of different bonds.
The Term Premium
All of our analysis to this point has been relatively theoretical. What has history actually shown?
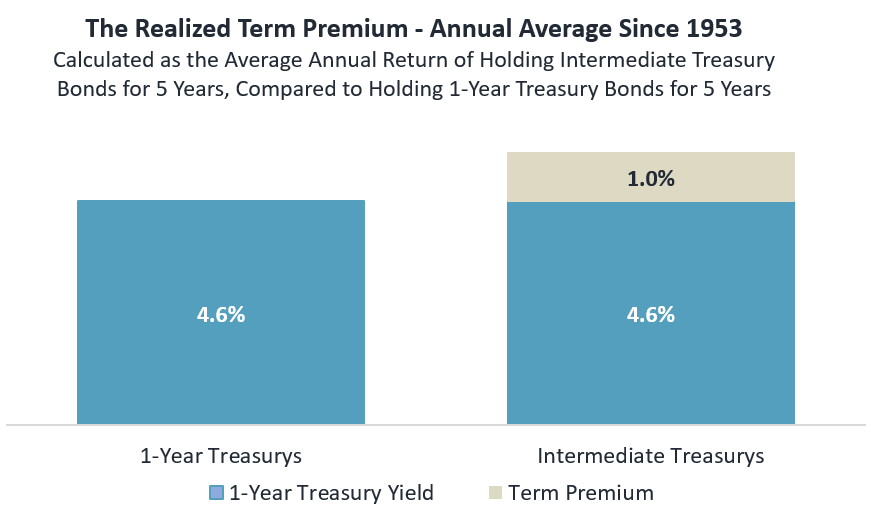
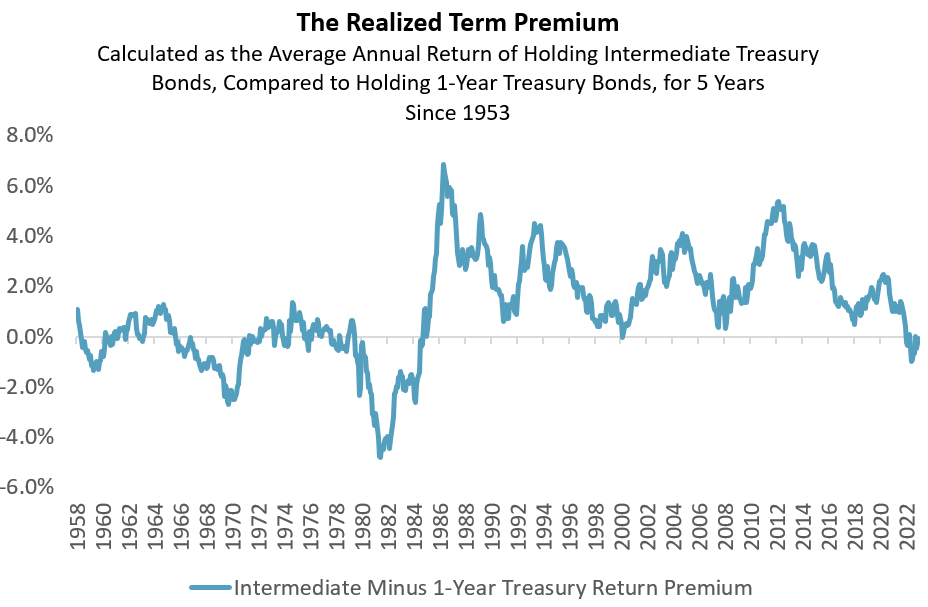
Since the second world war, U.S.-based investors have been rewarded, generally and on average, for holding longer-term bonds – i.e., in our example, holding the five-year Treasury bond instead of rolling one-year bonds. Since 1953, the actual realized premium of holding intermediate Treasury bonds instead of one-year Treasury bonds over all five-year periods has been 1% per year.
While the term premium has been positive on average, it has also been episodic:
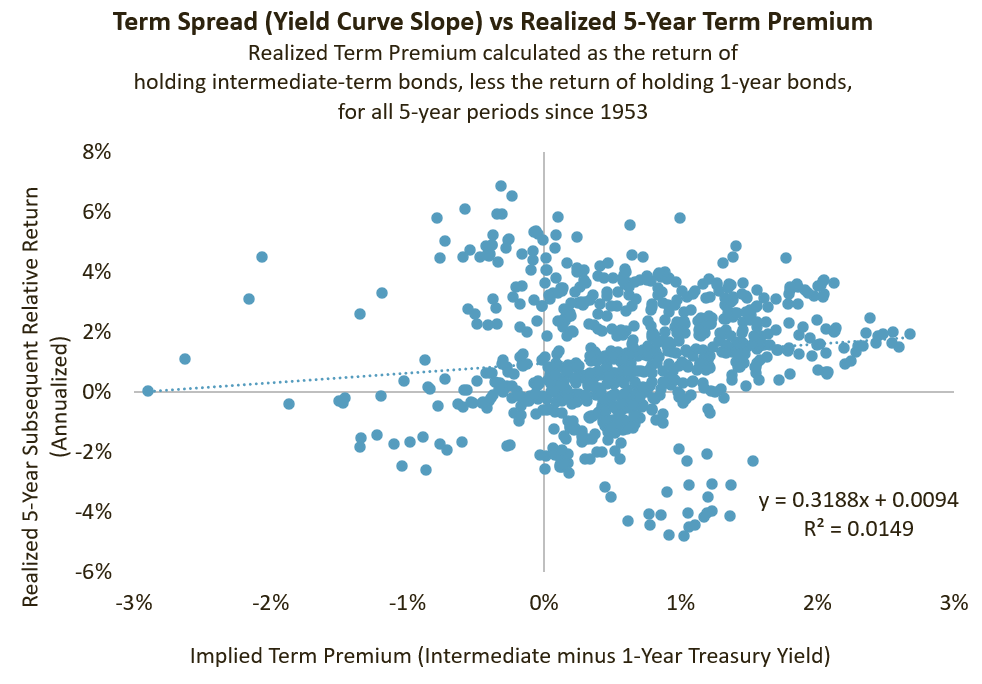
We wondered whether the realized term premium is a function of the slope of the yield curve at the beginning of the five-year period. After all, a positively sloped yield curve implies higher returns for investing in longer bonds, and vice-versa.
What we actually found, however, reinforces the lesson from our prior simple thought experiment: relative bond returns over a given horizon are determined only minimally by the shape of the yield curve at the outset. We define the “Implied Term Spread” as the shape of the yield curve at any point in time – the difference between the 5-year Treasury yield and the 1-year Treasury yield. We define the “Realized Term Premium” as the higher return that investors actually experienced, subsequently, by investing in the single 5-year Treasury bond instead of the series of sequential 1-year Treasury bonds. In the analysis below, we translated our thought experiment into a real-world analysis, using an intermediate Treasury index as a proxy for 5-year Treasurys and a one-year Treasury index to represent 1-year Treasurys.
The following chart depicts the relationship between yield curve shape and the subsequent return advantage to owning intermediate Treasury bonds over 1-year Treasury bonds, since 1953. If the realized term premium (advantage to owning intermediate bonds over 1-year bonds) were a function of the yield curve slope at the time of purchase, we would expect to see a tight, upward-sloping relationship. What we see instead is a very loose relationship. The R2 number implies that just 1% of the actual, realized incremental return associated with the intermediate bond strategy over the one-year bond strategy was the result of the yield curve shape at the time of purchase. Again, we find that the entry-point yield over the investor’s investment horizon – as opposed to the yield of the actual bonds purchased – is very difficult to escape.
The Purpose of Bonds in a Diversified Portfolio
Diverse investors own bonds for many reasons, but in most diversified portfolios, we view the primary purpose of bonds as mitigating equity risk. Changing a bond portfolio’s duration composition (i.e., shifting from intermediate bonds to short-term bonds) in search of higher bond returns risks eroding the value of bonds in a diversified portfolio.
Let us return to our comparison of intermediate-term Treasurys vs. one-year Treasurys. These two different Treasury bonds have different diversification properties in diversified portfolios.
Over the full history since 1953, both one-year and intermediate-term Treasurys have shown similar diversification properties to US stocks (with very modest return correlations of 0.07, each). Intermediate Treasurys have delivered a higher return, on average, owing to the term premium.
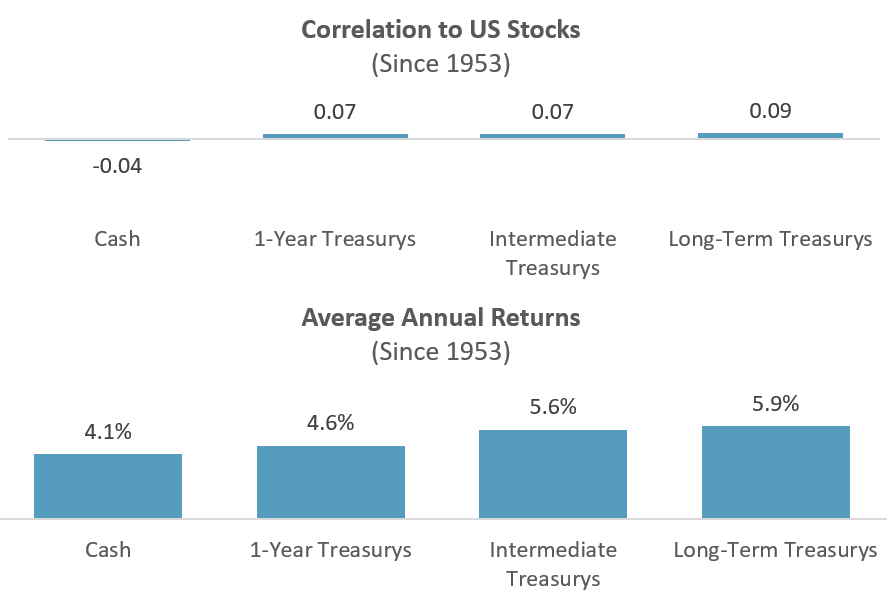
The story changes modestly when we consider only time periods when US stocks were declining – arguably, the only times when bonds provide value to diversified portfolios. When stocks were negative, investors would have had a slight preference for intermediate-term bonds over one-year bonds, with their similar correlation properties and higher returns.
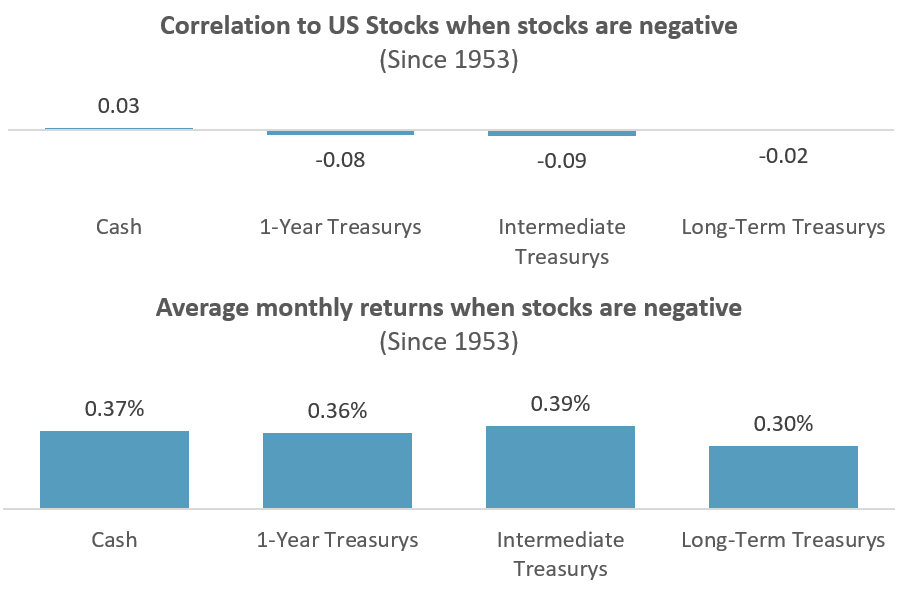
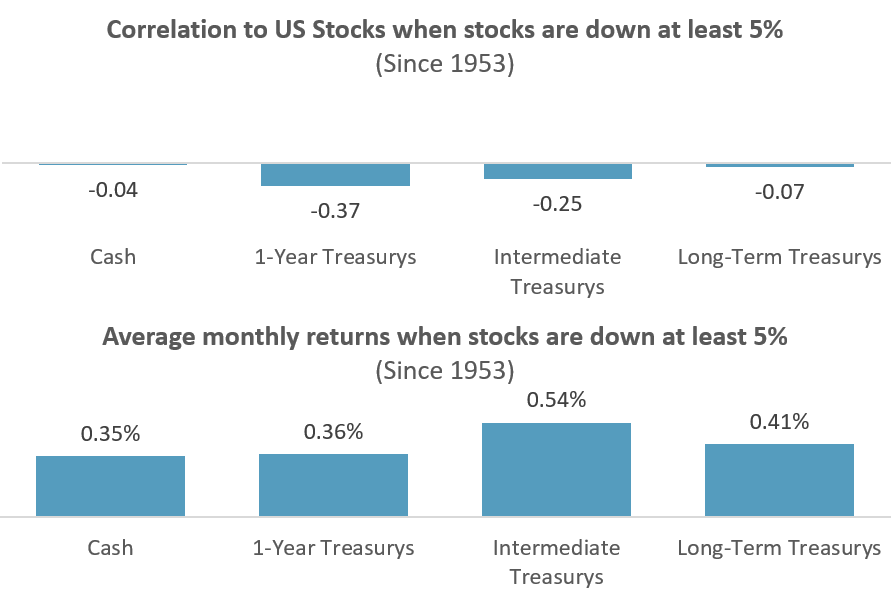
When stocks were strongly negative – falling at least 5% in a single month – investors likely would also have preferred intermediate Treasurys over one-year Treasurys. While the correlations to stock returns were lower for the one-year Treasurys in these periods, the returns were meaningfully higher for intermediate Treasurys:
If the role of bonds in an investor’s portfolio is to mitigate equity risk, then we suggest that seeking higher returns by moving from intermediate bonds to shorter bonds risks eroding the very purpose of the bonds in the portfolio. Even if such a strategy were to increase the return of the bond portfolio itself, it risks reducing the return of the overall portfolio by watering down the bonds’ essential diversification properties.
But Still, the Yield Curve is Inverted!
While we discourage short-term tactical asset allocation in general, we also find that the shape of the yield curve gives little information for practitioners of those dark arts.
Since 1966, the US Treasury yield curve has inverted 10 times. Again comparing intermediate-term Treasurys vs. one-year Treasurys, the returns for the two years following the initial inversion are depicted in the chart below. It is far from certain that yield curve inversion advantages one or the other, even in the short run:
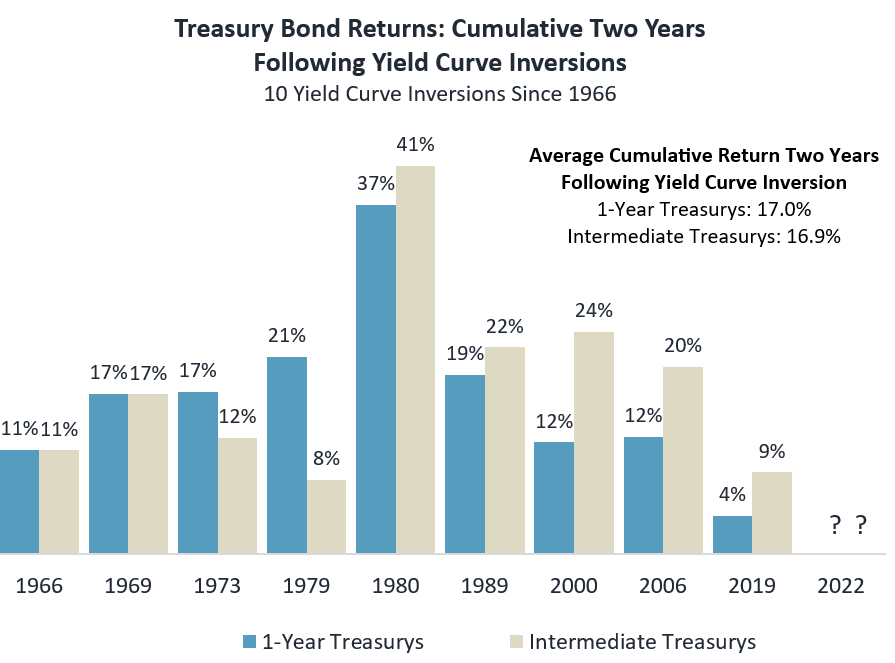
We draw two implications from this chart. First, historically speaking, the two years following a yield curve inversion has been a great time to be an investor in bonds. Second, it is striking that the average returns for one-year and intermediate Treasurys have been nearly identical in the two years following the yield curve inversion: 17.0% vs. 16.9%, cumulatively, on average. It is difficult to outsmart the bond market. Far better, in our estimation, to participate in it.
Conclusions
Investing in bonds is deceptive. On one hand, the Treasury yield curve tells us the return of holding a Treasury bond, with absolute precision. If an investor buys a 5-year US Treasury bond today and holds it to maturity, their return won’t be “approximately” 3.8% per year – it will be precisely 3.8% per year, assuming the US Treasury does not default. There is no other investment asset that makes this promise. In one sense, predicting the future returns for bonds is easy – just look up the yield.
But this very simplicity introduces subtle risks. It can be tempting to observe higher yields across the yield curve (currently, for shorter bonds) and seek out those bonds. Those returns are also precise estimates of future return – but only over the equally precise maturity horizon of the bond. An investor with a five-year investment horizon cannot count on a higher return for holding one-year bonds over five years, any more than they could count on a lower return for holding a ten-year bond over five years. Regardless of which Treasury bonds an investor actually owns, their expected return (best estimate of return) over five years is a number very close to the yield on the five-year Treasury bond. In fact, investors preferring to participate in the bond market for five years by owning multiple shorter bonds should likely expect a return slightly lower than the current yield for a five-year bond, given the term premium associated with owning the longer bond (historically, 1% per year, on average).
We counsel investors to train their focus on the role of bonds in their portfolios. For most diversified portfolios, the purpose of bonds is not to generate return – it is to mitigate the risk of stocks. If this is the case, then seeking incrementally higher yield from a bond portfolio by shifting its duration in response to the shape of the yield curve potentially undermines their very purpose in the portfolio. Additionally, both theoretically and empirically, it doesn’t add clear portfolio value.
Sources: Sellwood Consulting LLC, the Federal Reserve, and Ibbotson Associates, via Morningstar. All index return data is from Ibbotson/Morningstar, and all calculations are by Sellwood Consulting. Yield information is from the Federal Reserve and is as of 5/30/2023.
When we say “US Stocks,” we mean the IA SBBI US Large Stock TR USD Ext Index. “Intermediate-Term Treasurys” is the IA SBBI US IT Govt TR USD Index. “One-Year Treasurys” is the IA SBBI US 1 Year Constant Maturity Total Return USD Index.