
2022 was a brutal year for markets, offering few places to hide to novice and professional investors alike. As we transition to 2023, the following questions are top of mind:
- How does 2022 market performance compare to history?
- What is the near-term outlook for a recession?
- How should recent economic data be interpreted?
2022 Investment Year in Review
Drawdowns in asset prices were widespread and severe in 2022. U.S. stocks fell 19%. Non-U.S. stocks fell 15%. Investment-grade “core” bonds, which typically protect against sudden declines in stock prices, declined 13%. Chart One below plots stock and bond returns by calendar year, dating back to 1926. There have only been three years in history (1931, 1969 and 2022) when stocks and bonds both declined in the same calendar year. 2022 was the sixth worst year for stocks since 1926 and the worst year for bonds in modern history, by a wide margin.
Chart One: U.S. Stock & U.S. Government Bond Returns: 1926-2022
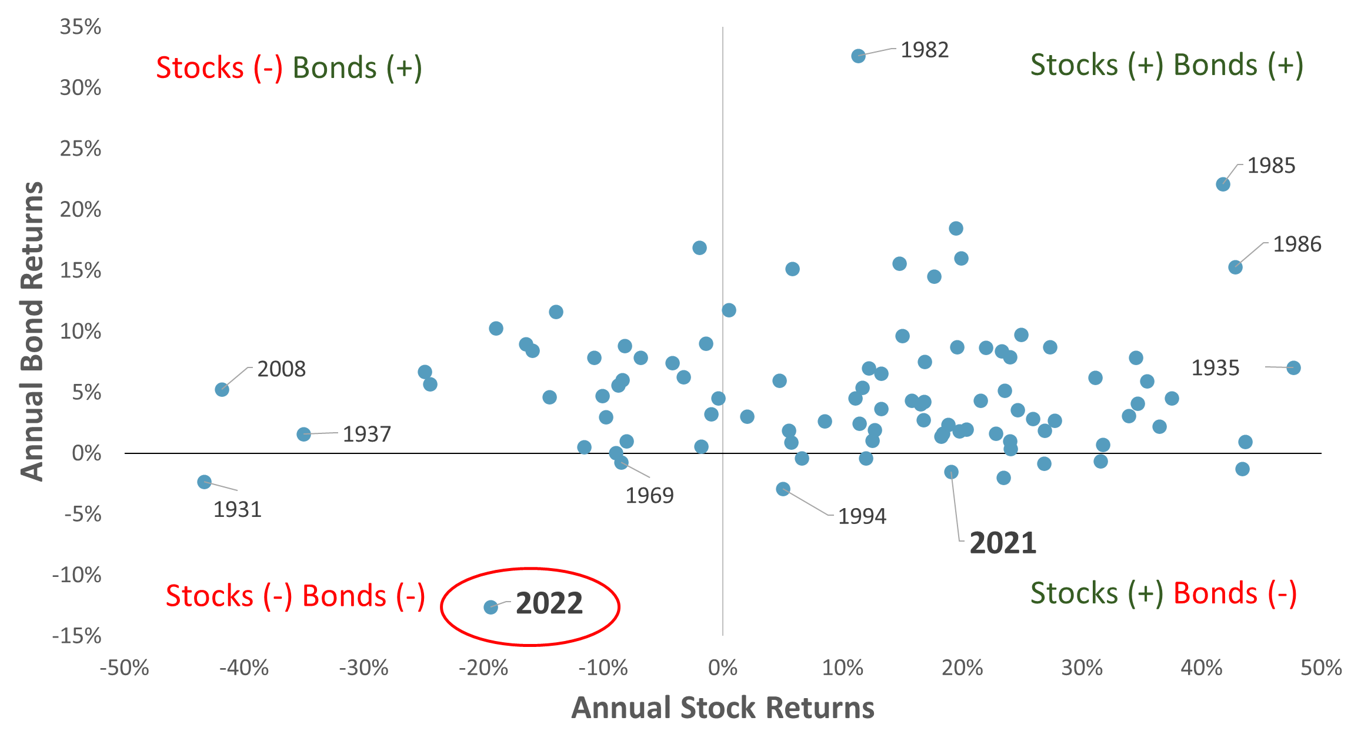
Source: Morningstar, Sellwood Consulting.
Over the last two decades, stocks and bonds have reliably diversified one another. In 2008, for example, when stocks fell 42%, investment-grade bonds appreciated 5%. This relationship, however, has recently changed. Specifically, the correlation coefficient of stocks and bonds, which had been negative for 20 years, shot up rapidly in 2021-2022, turning positive. This represents a return to the correlation relationship between stocks and bonds that had prevailed in the 40 years before the year 2000.
Chart Two: Stock & Bond Correlations
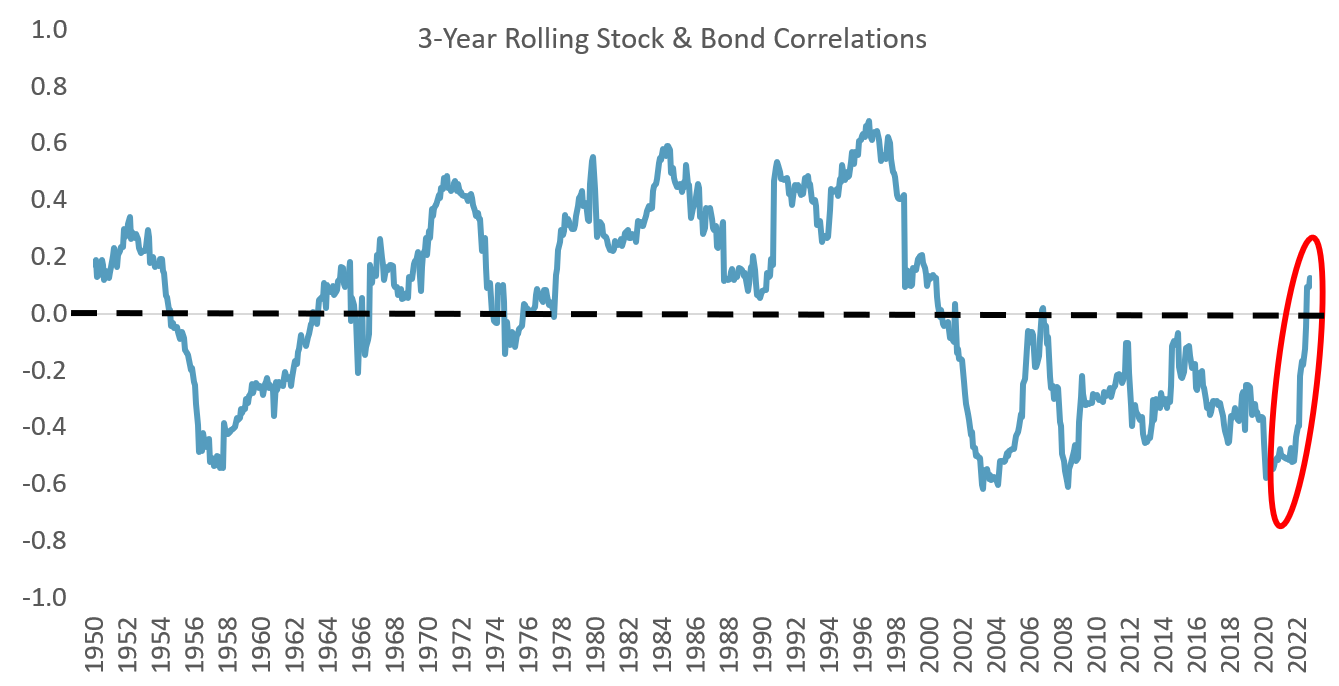
Source: Morningstar, Sellwood Consulting.
This raises the question, “Is Diversification Dead?” According to Antti Ilmanen of quantitative asset manager AQR, “We have a nice story on why the sign flipped from positive to negative 20 years ago. Stocks and bonds tend to be driven by growth and inflation. When there is more growth uncertainty, stocks and bonds tend to move in opposite directions, so we’ve had negative stock/bond correlation for the last 20 years. Before that, there was, relatively speaking, more inflation uncertainty, and we tended to have positive stock/bond correlations. So, we are waiting to see if those relative uncertainties flip again.”
What should an investor expect going forward? Will bond and stock diversification resemble the last 20 years or the 40 years prior? In the past 20 years, bonds have diversified stocks due to economic growth uncertainty. In the current interest rate environment, however, it is likely that both growth uncertainty and inflation uncertainty will surface, potentially leading to less diversification benefit between stocks and bonds. Nonetheless, we still recommend that investors own bonds, as bonds should diversify in periods of extreme economic uncertainty, particularly during rapid stock market selloffs. It is impossible to know in advance whether there will be more growth or inflation uncertainty, strengthening the argument for a strategic allocation to bonds.
The Economy in 2023: Bending, Breaking, or Pivoting?
The 12-year period following the Global Financial Crisis (2009-2021), was characterized by steady Gross Domestic Product (“GDP”) growth, increasing corporate profits, and disinflation (when goods and services prices rise, but at progressively slower rates). Conditions were favorable for asset prices, leading investors to shift from traditional investments, such as government bonds, to higher-returning sectors of the market. With risk came reward, leading to the longest bull market in history. Investment speculation was encouraged. The real risk, in many investors’ eyes, was missing out.
This behavior was driven by the Federal Reserve’s aggressive monetary policies, which included lowering interest rates to zero, and purchasing trillions of dollars in bonds along with other central banks. These policies resulted in low borrowing costs across the economy, contributing to excess liquidity and market dislocations we are seeing today. This period (2009-2021) was marked by:
- Rising stock prices
- Low price volatility in financial assets
- Low borrowing costs for risky borrowers
- Low correlations
- Rising home prices
- A steep yield curve
- Opportunities in less liquid markets
2022 has seen a reversal of these trends. Stocks fell, volatility rose, credit spreads climbed, correlations rose, the yield curve inverted, home prices fell, and areas of low liquidity (in public markets for now) declined more than similar areas with high liquidity.[1] But how bad are things economically? Data on U.S. production, inflation, and employment frame the economic environment.
U.S. Economic Production Outlook
U.S. real Gross Domestic Product (GDP) is at its highest level in history, but the growth rate of GDP has been inconsistent and has slowed over the last several quarters. The COVID-19 pandemic caused a low point in annualized GDP growth (-8.4%), but GDP growth quickly rebounded, to 12.5%. Now, GDP growth rates are positive but have slowed down as consumers, companies, and governments adjust their spending habits to the current economic climate. This includes rising prices, increased unpredictability, and uncertainty about the value of assets.
Chart Three: Real GDP Level, Growth
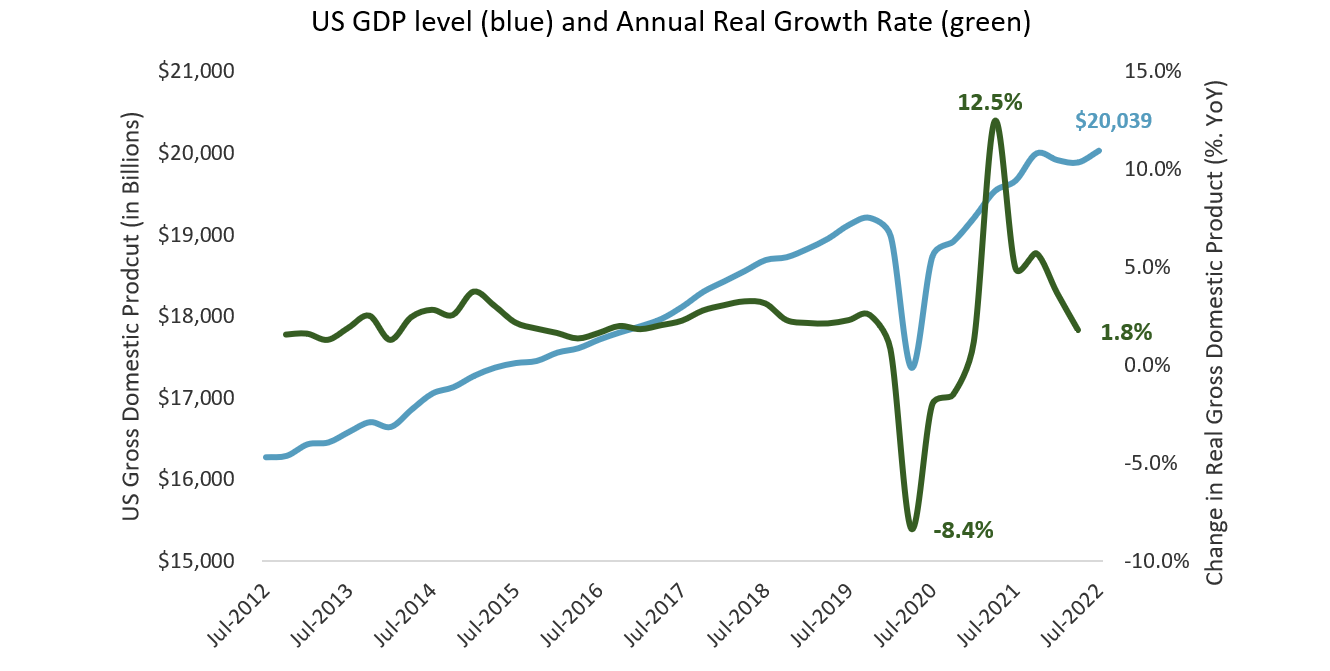
Source: St. Louis Federal Reserve, Sellwood Consulting.
The Federal Reserve is trying to slow down the economy gradually, but a recession seems likely. A survey by the Conference Board found that most CEOs, regardless of company size, expect a recession within the next 12 to 18 months. This survey reported the lowest levels of CEO confidence since the Great Recession. When asked about expectations for the next 12 to 18 months, 98% of CEOs said they were preparing for a recession in the United States, and 99% of CEOs reported preparing for a recession in Europe.
In response to economic uncertainty, relative U.S. economic strength, and higher cash rates, market participants have pushed the value of the U.S. dollar to multi-decade highs. The dollar is considered a safe haven compared to other currencies, and its strength is not surprising given higher economic growth and higher interest rates in the U.S., compared to the rest of the world. Many analysts predict that the dollar’s strength will decrease in 2023 due to lower expected growth in the U.S., improved growth prospects in other countries, and the Federal Reserve easing its monetary policies, which would reduce dollar support. A declining dollar would act as a tailwind for investments held by U.S. investors denominated in foreign currencies (e.g., international stocks).
Chart Four: Dollar Strength YTD
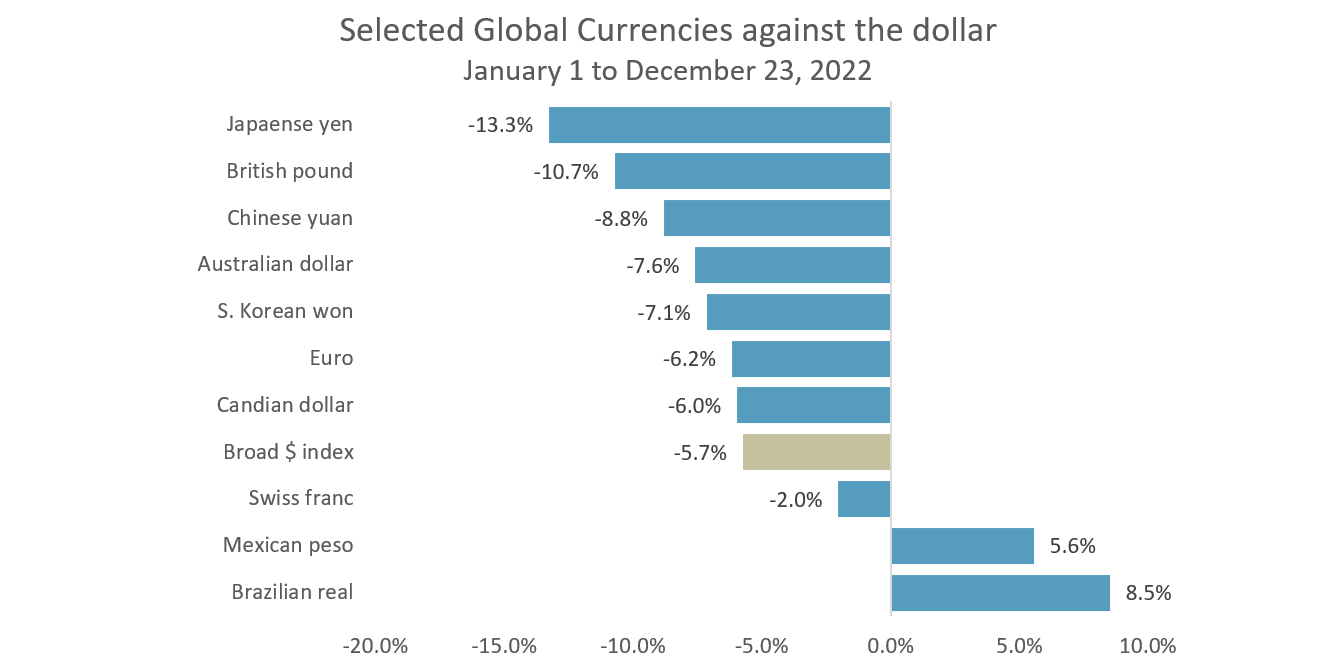
Source: St. Louis Federal Reserve, Sellwood Consulting.
U.S. Inflation Outlook
“Low and stable inflation in many countries is an important accomplishment that will continue to bring significant benefits.”
-Ben Bernanke, Chairman of the Federal Reserve, 2006-2014, 2022 Nobel Prize in Economics
“Inflation is like toothpaste. Once it’s out, you can hardly get it back in again.”
-Karl Otto Pohl, President of the German Bundesbank, 1980-1991
As noted, the period from 2009-2020 was characterized by disinflation. In 2021 and 2022, inflation by every measure has accelerated. Inflation has trended well above the Federal Reserve’s intended target of 2%, independent of which inflation measure is used. We present Consumer Price Inflation Index (“CPI”), Producer Price Inflation Index (“PPI”), and wage inflation over data over the last ten years in Chart Five below.
Chart Five: Inflation Measures 2001-2021
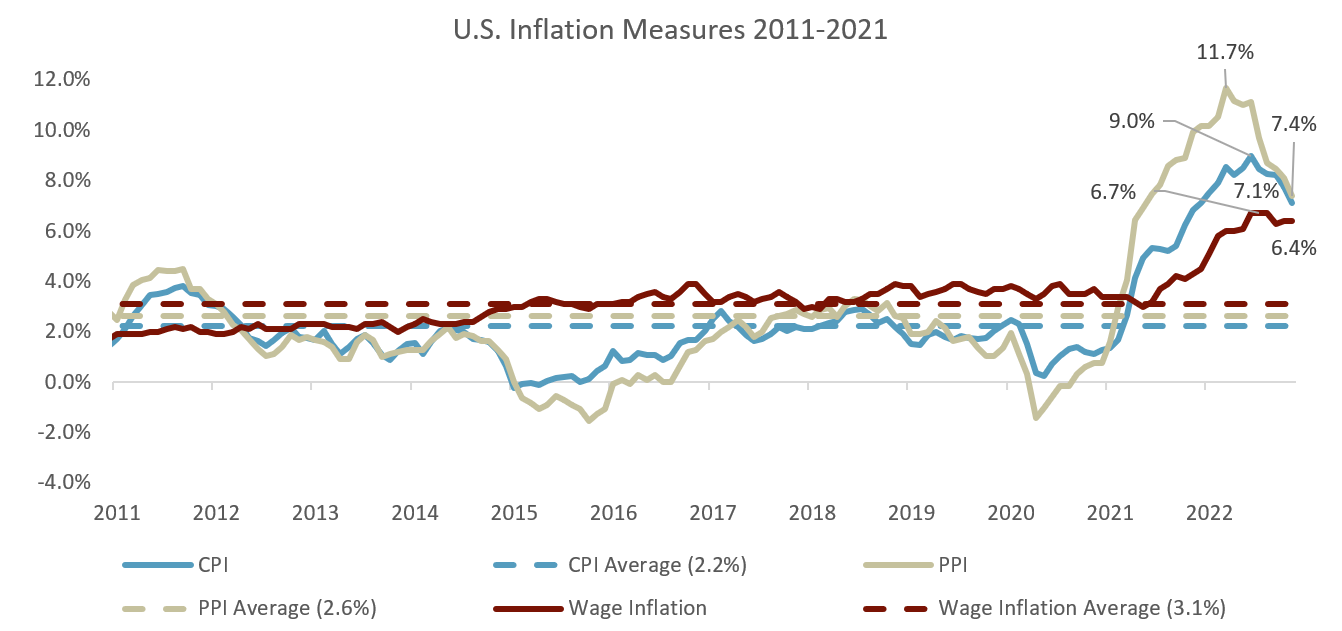
Source: St. Louis Federal Reserve, Sellwood Consulting.
Inflation – measured by the Consumer Price Index (CPI), Producer Price Index (PPI), or wages, began accelerating in early 2021. We note that each of these inflation measures is showing signs of moderating, suggesting that higher rates are reducing demand.
But why is inflation so high? Inflation at its core is caused by too much money chasing too few goods. Analyzing aggregate demand and supply can provide answers.
In the U.S., aggregate demand is a story of consumer confidence, as consumer spending accounts for approximately 60% of U.S. production. Monetary and fiscal policymakers flooded consumers and businesses with stimulus as COVID-19 lockdowns began.
Over $5 trillion in total stimulus was distributed with individuals and families ($1.8 trillion), and businesses ($1.7 trillion), as the largest beneficiaries. The largest prior fiscal stimulus, enacted by President Obama in 2009, was a paltry $831 billion by comparison. As can be seen in the table below, stimulus payments were approved even after the economy was recovering. The net effect of this was to raise consumer and business spending (demand) substantially.
Table Six: $5 Trillion in COVID Stimulus
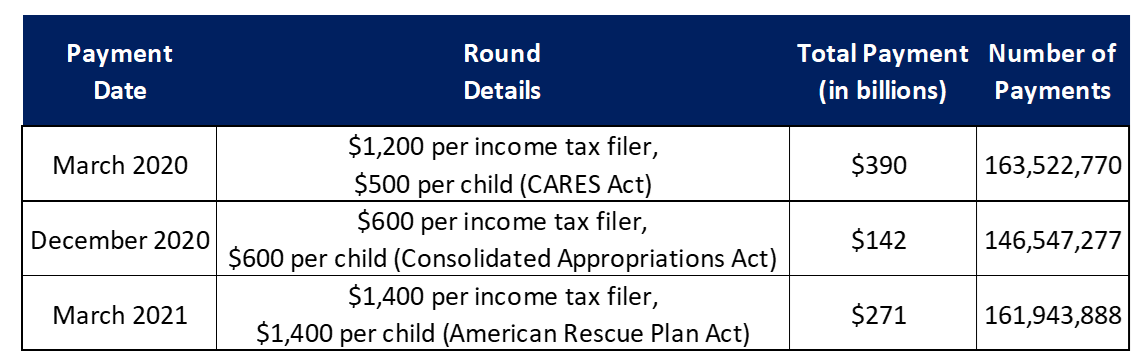
Source: pandemicoversight.gov
On the supply side of the equation, the availability of both goods and services in the economy was impacted by COVID-19 around the globe. Further, as we transitioned to 2022, Russia invaded Ukraine, providing additional inflationary pressures, particularly related to energy and grain prices. As seen in Chart Seven below, inflation was widespread, with categories influenced by commodity prices hit particularly hard over the last year.
Chart Seven: Consumer Price Index Categories in 2022
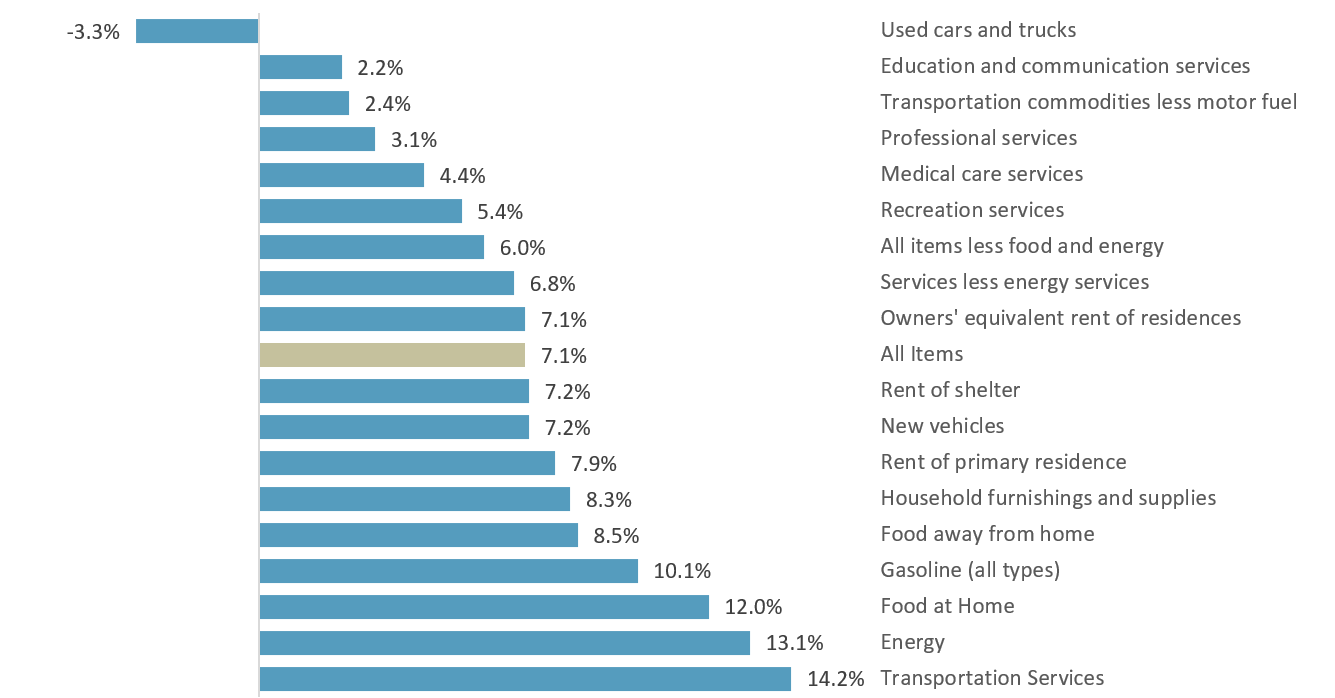
Source: St. Louis Federal Reserve, Sellwood Consulting. Data reflects 11/30/2021-11/30/2022.
How has the Federal Reserve responded to high inflation? In 2021, the Federal Reserve believed that inflation was “transitory” and would ultimately trend downwards toward long-term policy targets. The Federal Reserve has two “mandates” that it tries to achieve through its monetary policy: maintain a stable level of inflation near 2% and promote maximum employment.
From 2009 to 2020, the Federal Reserve’s dual mandates of promoting low unemployment and maintaining stable prices were aligned due to disinflationary forces. In other words, flooding the market with money, through easing measures, supported both mandates in a disinflationary environment. However, in 2021 the situation changed, with high levels of employment coinciding with high levels of inflation. As a result, the Federal Reserve’s two mandates are no longer aligned, and future policy may require uncomfortable tradeoffs between the Fed’s dual mandates.
In 2021, after a decade of being below it, inflation was rising faster than the Federal Reserve’s 2% target. To try to address this, the Fed implemented a policy known as “tapering,” which reduced its purchases of bonds. At the same time, the Fed sought to avoid causing a recession by carefully balancing the reduction of stimulus with the health of the economy.
Ultimately, the Fed’s efforts to “thread the needle” between controlling inflation and avoiding a recession were not successful, as inflation has remained above target and the economy has suffered. However, monetary policy operates at a significant lag, and as we transitioned to 2022, and interest rates were climbing, it was clear that the Federal Reserve needed to bring down rates. By March of 2022, Jerome Powell took a page out of the Paul Volcker playbook and began raising the federal funds rate rapidly. This is seen in Chart Eight below:
Chart Eight: Powell’s FED Takes a Page Out of the Volcker Playbook
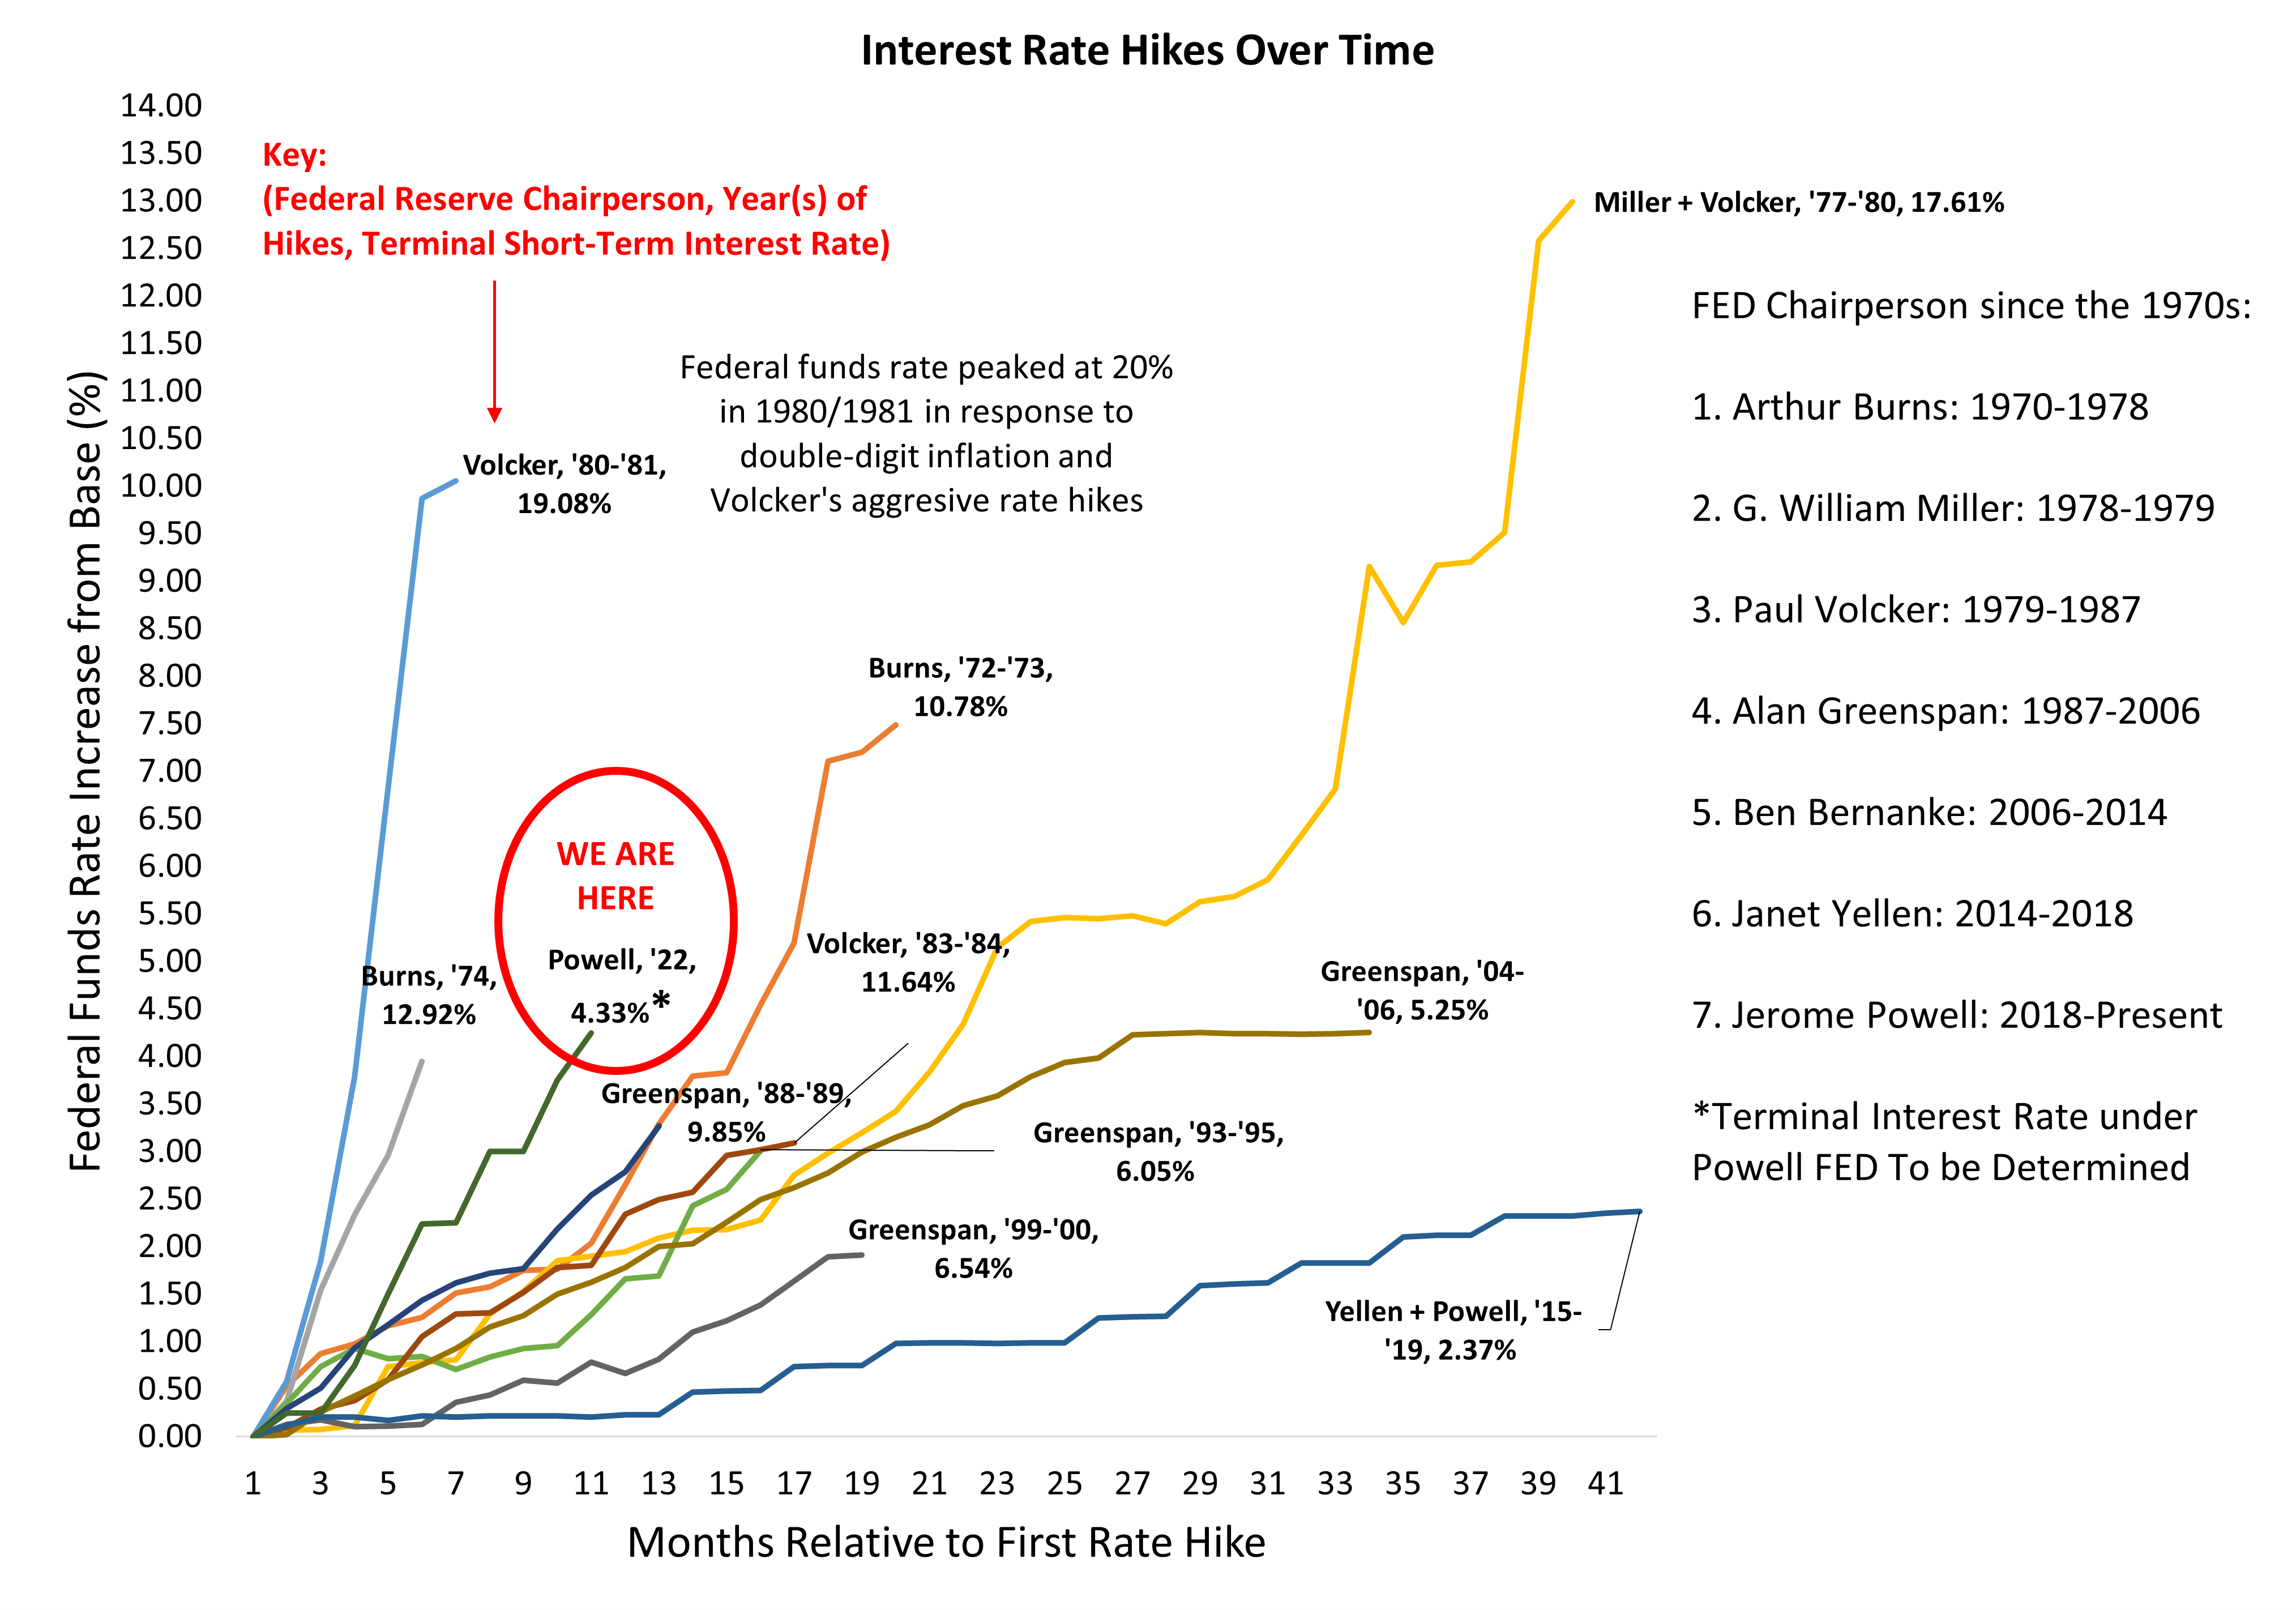
Source: St. Louis Federal Reserve, Sellwood Consulting.
How many additional rate hikes should we expect? History provides a guide (see above), as does economic theory. According to Greg Mankiw, Professor of Economics at Harvard, “The question is, how much monetary tightening is in order? This question is hard, and anyone who claims to know the answer for sure is not being honest either with you or with themselves…The Taylor rule[2] suggests one way to calibrate the problem. This rule of thumb says that the real interest rate needs to rise by 0.5 percentage points for each percentage point increase in inflation. The yield on the 5-year TIPS, which incorporates recent and near-term expected changes in monetary policy, has risen by 330 basis points over the past year[3]. According to the Taylor rule, that would be appropriate if inflation had risen by 6.6 percentage points.”
As noted previously, many inflationary measures have exceeded 6.6%, with only recent inflation data trending downward. These data points argue that the Fed has not tightened enough. Wage inflation, which tends to be stickier, follows a similar trend. Wage inflation peaked in August 2022 at 6.7%, and has now retreated to 6.4%. Continued strength in employment and wage growth contributes to inflationary pressures.
Finally, the market provides its own assessment about the future path of inflation. For this, we look to TIPS breakeven spreads.[4] Using this measure, Fed policy is close to anchoring longer-term inflation expectations at a 2% target. This should help reduce inflation and interest rate uncertainty in 2023. Further, the negative wealth effect from asset price declines in 2022 (stocks, bonds, real estate, and cryptocurrencies, to name a few) should further dampen consumer demand.
Chart Nine: Breakeven Inflation Rates
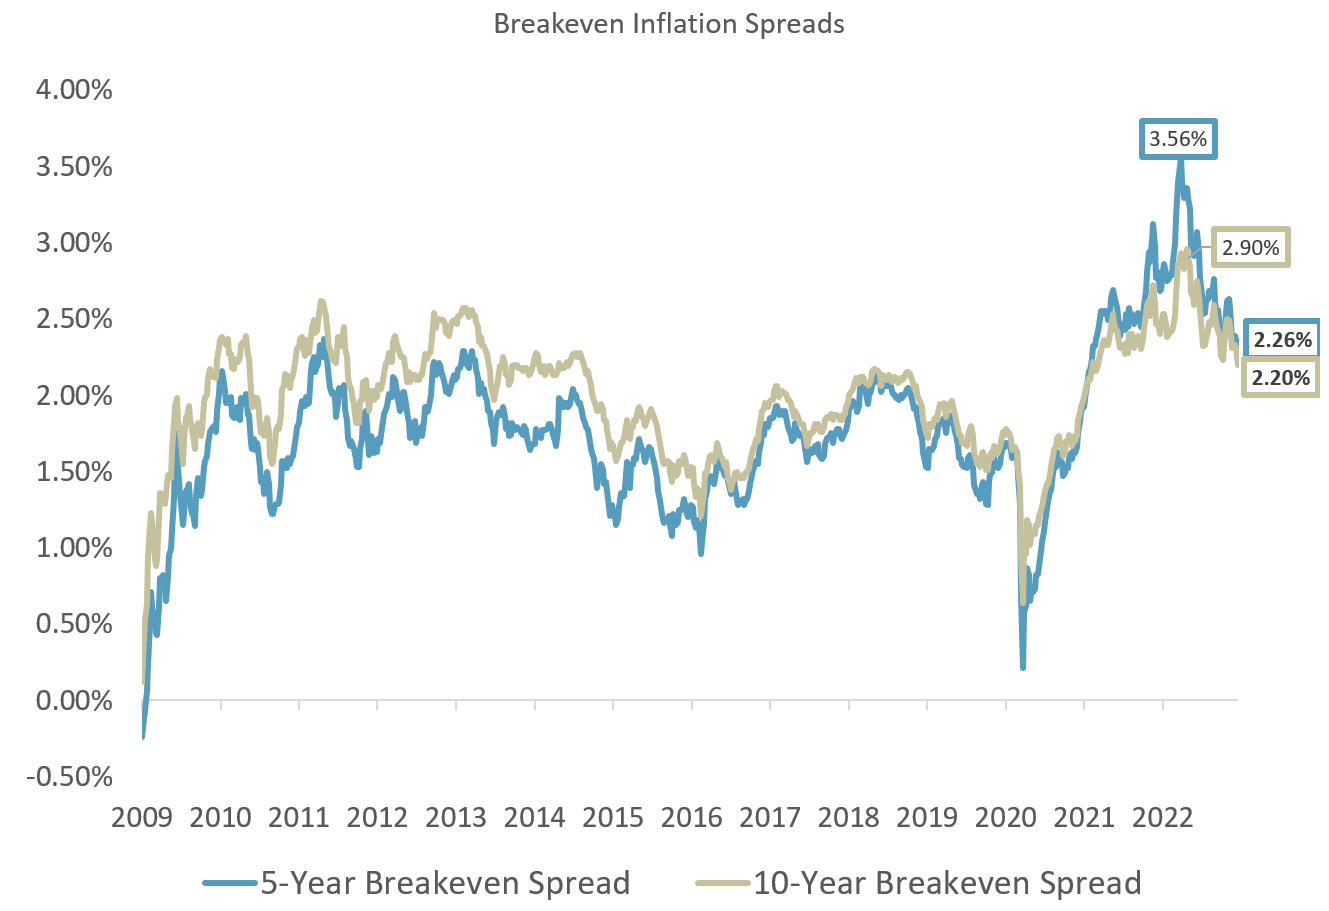
Source: St. Louis Federal Reserve, Sellwood Consulting.
U.S. Employment
“Unemployment is a side effect of the cure for inflation.”
-Milton Friedman, American Economist, 1976 Nobel Prize in Economics
Chart Ten: U.S. at Full Employment, Average Earnings Strong
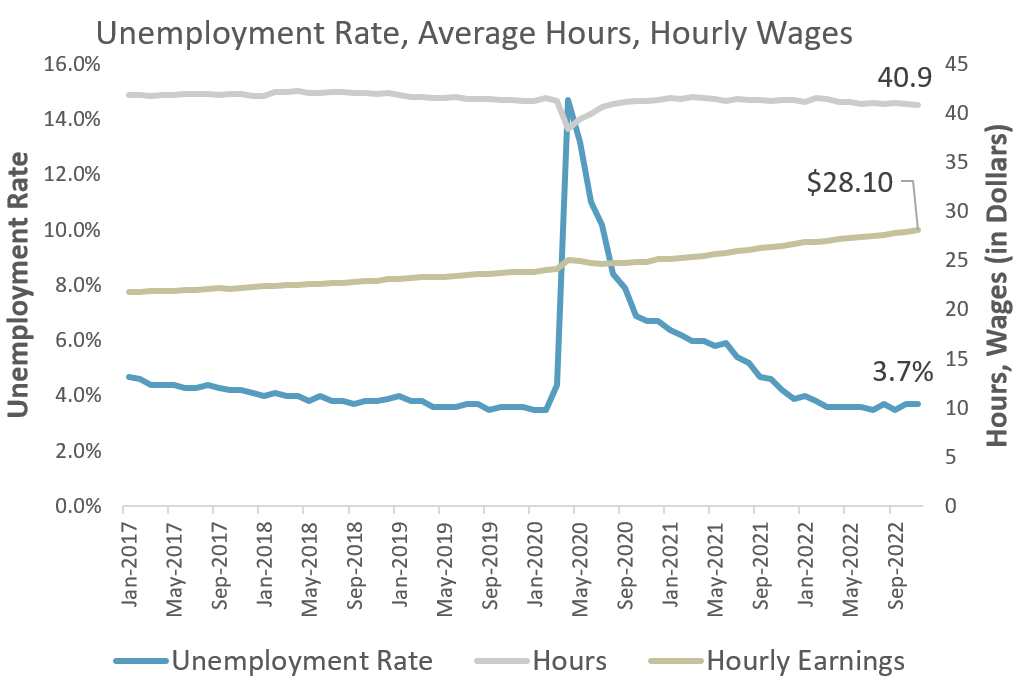 Source: St. Louis Federal Reserve, Sellwood
U.S. employment was red hot in 2022 and it continues to look strong. The unemployment rate is low at 3.7%, while average hours and wages continue to increase. The number of current openings at 10.3 million is well above trend, as are voluntary quits at 4 million. These data points paint the picture of a healthy labor market as workers are more willing to quit when jobs are abundant.[5]
Making Sense of Recent Economic Data
Economic forecasts are difficult, and forecasting a recession is no different. On the one hand, most market participants are expecting a recession. On the other hand, the Federal Reserve believes that it can orchestrate a soft landing and avert a recession. The uncertainty surrounding the question has widespread influence across capital markets. Howard Marks of Oaktree Capital captured market sentiment and fundamentals effectively in a recent memo:
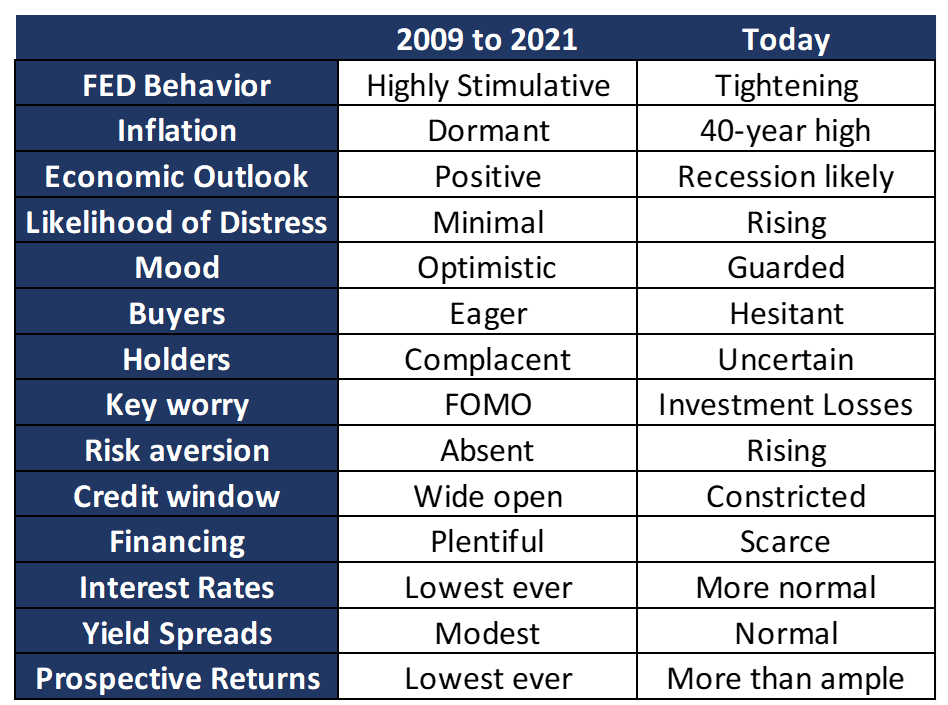
Source: Oaktree Capital.
The abrupt rise in interest rates in 2022 took many investors off guard. Rapidly rising rates had a significant impact on markets and contributed to price declines across most asset classes. To avoid another surprise, market sentiment and fundamentals should be carefully evaluated by investors as they navigate the upcoming landscape.
Current economic data are mixed, with some indicators pointing toward positive conditions and others indicating potential challenges. The continued role of inflation, which could impact the effectiveness of bonds as a diversifying investment, remains a primary concern. In the coming months, we will likely see both economic growth uncertainty and inflation uncertainty. This would make it more difficult for bonds to diversify stocks compared to an environment where economic growth uncertainty dominates.
As we begin the year 2023, it is important for investors to consider the impact of changing economic conditions. At the same time, it’s important to keep in mind that much of the available economic data is focused on the short term and may not have a significant impact on long-term investment strategy. Despite all the economic and market uncertainty, one thing we know with certainty is that the future return of any investment depends on the price paid for it. Lower prices today compared to a year ago offer opportunity. In the second part of this report, we will discuss the implications of current market conditions on portfolio design, and evaluate several opportunities that the market is offering as the calendar turns to 2023.
[1] Private investment strategies are less liquid than public investment strategies but have largely not been repriced in the current economic environment. We expect that write-downs in private markets portfolios will lag drawdowns in public market indices.
[2] The Taylor Rule is a monetary policy guideline that is used by central banks to help determine the appropriate level of interest rates. It is named after economist John Taylor, who developed the rule in the early 1990s.
[3] Since this quote was published (10/19/2022) the yield on 5-year TIPS has declined to 232 basis points, implying that rate hikes are lowering forward real interest rate expectations.
[4] The difference in yields between Treasuries and TIPS of the same maturity. This spread is a measure of expected inflation (i.e., inflation that is priced into the market) over the life of the bond.
[5] Source: https://www.nytimes.com/2022/09/29/opinion/columnists/federal-reserve-inflation.html