
The dozen years following the 2008-09 Global Financial Crisis can be separated into two distinct market narratives, both of which are currently being unwritten.
The first narrative period spanned the decade following the 2008 financial crisis and was characterized by low interest rates, low growth, lackluster aggregate demand, a global economy flirting with deflation, and a “Fed put” that placed an implied floor beneath the stock market. Many market observers, including Sellwood, observed a prospective “low return environment” characterized by low yields for both stocks and bonds.
The second narrative period began as COVID upended the economy in early 2020. It witnessed a rapid economic transition from the production of services to goods, supply chain constraints, and unprecedented fiscal and monetary stimulus. The sense that COVID “pulled forward” several years of previously gradual market transition from physical to digital sent a small group of stocks and speculative investments skyward. Whether it was a transition from offices to working from home, or shopping in malls to shopping online, or from gyms to Peloton, restaurants to Doordash, or even traditional currencies to cryptocurrencies, the post-COVID moment was characterized by a sense of dramatic transition from “old economy” to “new.” In markets, persistent historically low rates, large amounts of liquidity, and good old-fashioned fear-of-missing-out (FOMO) forced investors further out on the risk/return curve, from the safety of bonds to the risk of stocks, in a “There is No Alternative (TINA)” market.
As detailed in our 2022 Economic & Market Review paper, 2022 changed all that. 2022 was the year when the world emerged from COVID, shoppers returned to malls, and diners to restaurants. It was also a year that the Federal Reserve was forced, by inflation, to abandon the easy money policies that have characterized the better part of this century, so far. In 2022, long-duration assets (both bonds and stocks that expect their profits well into the future) collapsed along with the prevailing narratives of the last dozen years. As the Federal Reserve has reset the risk-free rate, the risk premiums offered by various corners of the capital markets are still finding their locations, as new market narratives take hold.
This reshuffling of the economic and market landscape offers opportunity for thoughtful long-term investors. While we are humble about making predictions – “Predictions are difficult, especially about the future”[1] – we recognize that a reshuffled deck offers new opportunities. This paper identifies several opportunities for portfolio improvement whose risks, we judge, are compensated for long-term investors:
- Value
- Small Cap
- Non-US Equity
- Bonds
- Low-correlation alternatives
Stocks
Stocks are far from cheap, but the era of needing to buy overpriced equities because “There is No Alternative” is over. Stocks represent much better bargains than a year ago, almost as if competition from bonds (see below) has forced them to become more attractive.
In 2022, the US stock market declined by 19.2%.[2] While US corporate earnings declined by an estimated 4.2%, this fact alone was not enough to explain the market’s decline, most of which was a reduction in the price investors were willing to pay for a dollar of those corporate earnings. This multiple reduction can be explained by rising rates (making future earnings dollars worth less today), expectations for lower future earnings (recession fears), or simple mood and risk preference changes. We note, however, that the P/E contraction witnessed in 2021 and 2022 merely reversed a mirror-image expansion that occurred in 2020. As the “post-COVID economy” narrative has unwound, so have the valuation premiums investors have been willing to pay for future earnings.
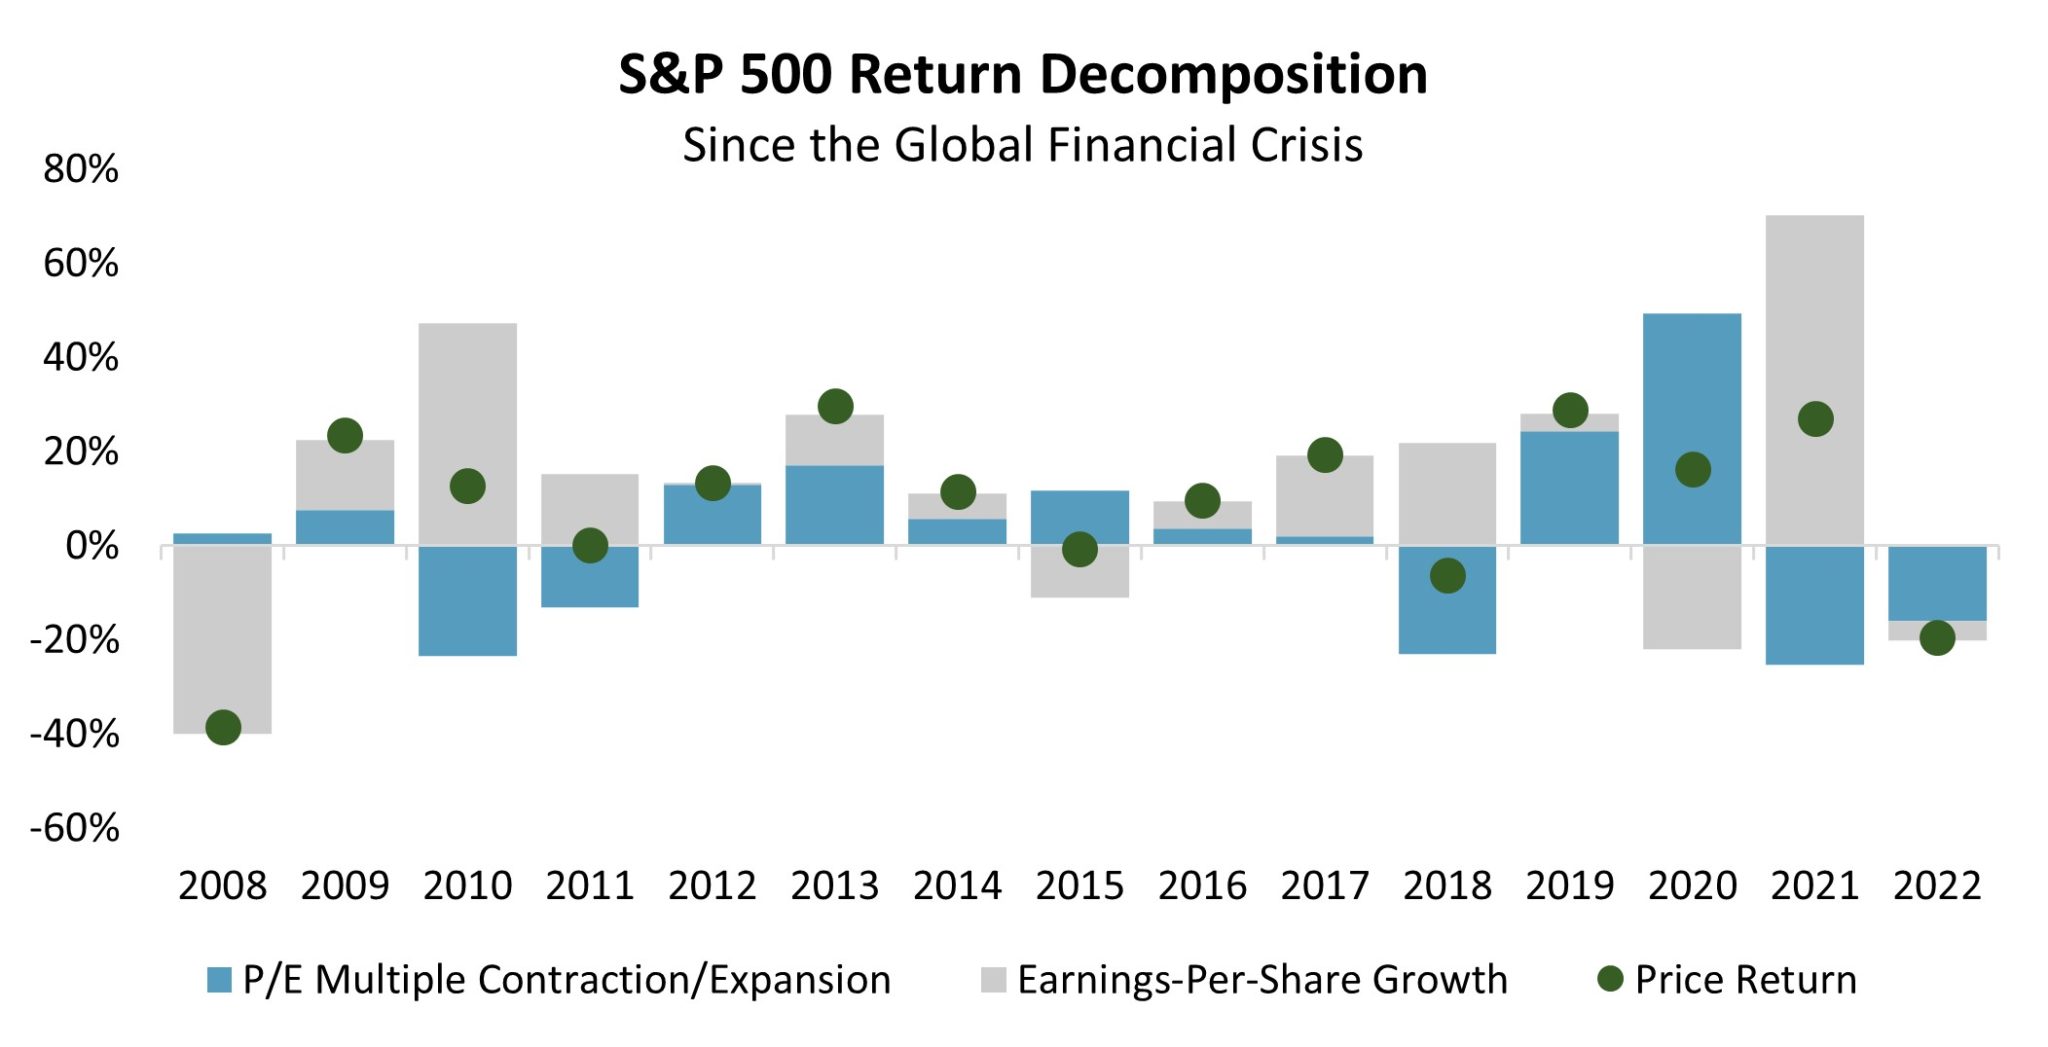
Source: Standard & Poors, Sellwood
Value
While 2022 offered few places to hide, value stocks offered some shelter: across all capitalizations, US value stocks declined 8%, compared to a 29% decline for their longer-duration growth counterparts.[3] Despite this recent outperformance, we believe that value remains a compensated risk going forward, for several reasons.
First, should inflation remain elevated, value companies should benefit. Value companies tend to be more indebted than growth companies, meaning both that inflation erodes the real value of their debt and also that their higher operating leverage will convert more future revenues to profits, compared to growth companies. Additionally, being less speculative than growth companies, value companies tend to expect more of their future profits sooner, making them less susceptible to rising rates.
Second, the market itself has become more “growth” oriented over the last decade. It used to be the case that buying the entire market, for example in an index fund, would deliver a “core” (neither value nor growth-leaning) portfolio. This is no longer the case. Even after 2022, growth (especially a handful of technology) companies are simply so large that capitalization-weighted indexes tend to deliver growth, not balanced core, exposure. Depending on the degree, leaning a portfolio toward “value” may only return it to style neutrality. In 2023, an investor can have market exposure, or style balance, but not both.

Source: Morningstar, Sellwood
Third, relative valuations are still attractive, even despite value’s strong outperformance in 2022.
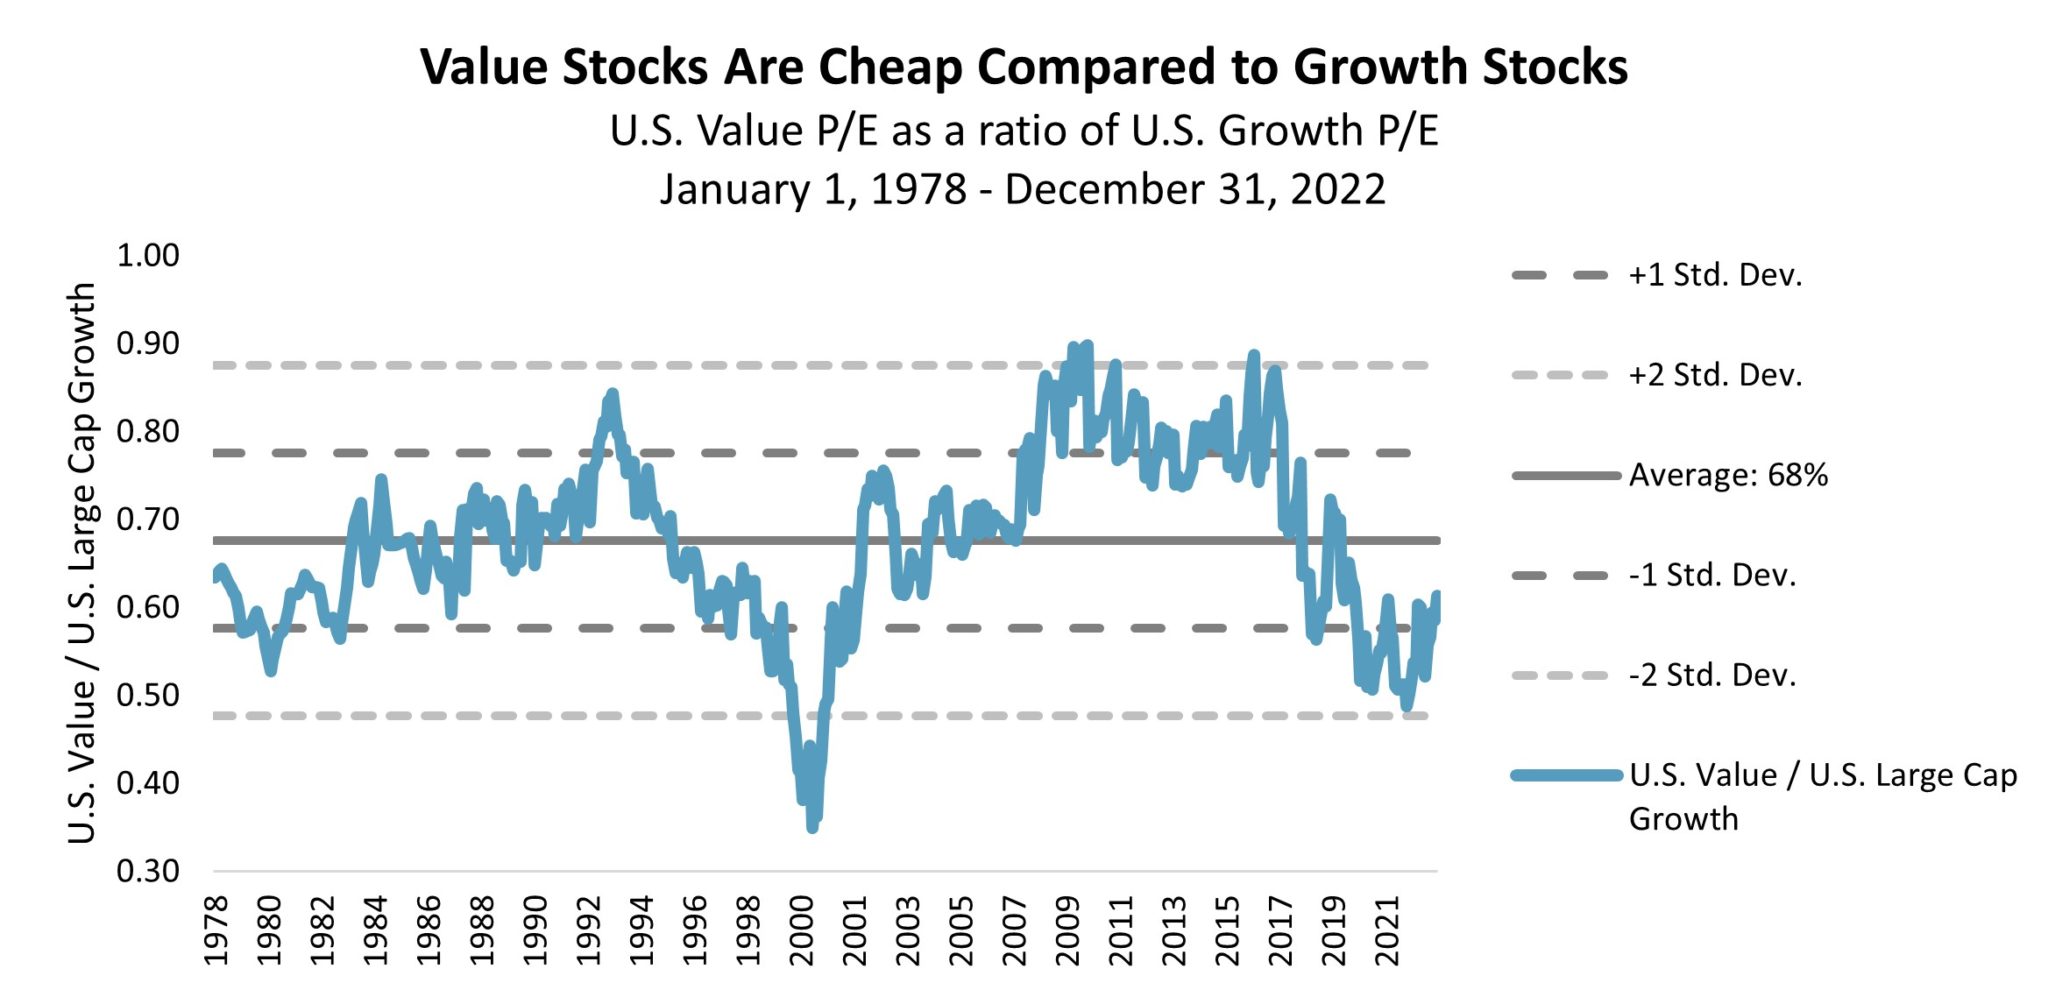
Source: FTSE Russell, Sellwood
Finally, investor preferences for value and growth companies tends to observe cycles. Historically speaking, it would be rather early for a value cycle to come to its end this early.
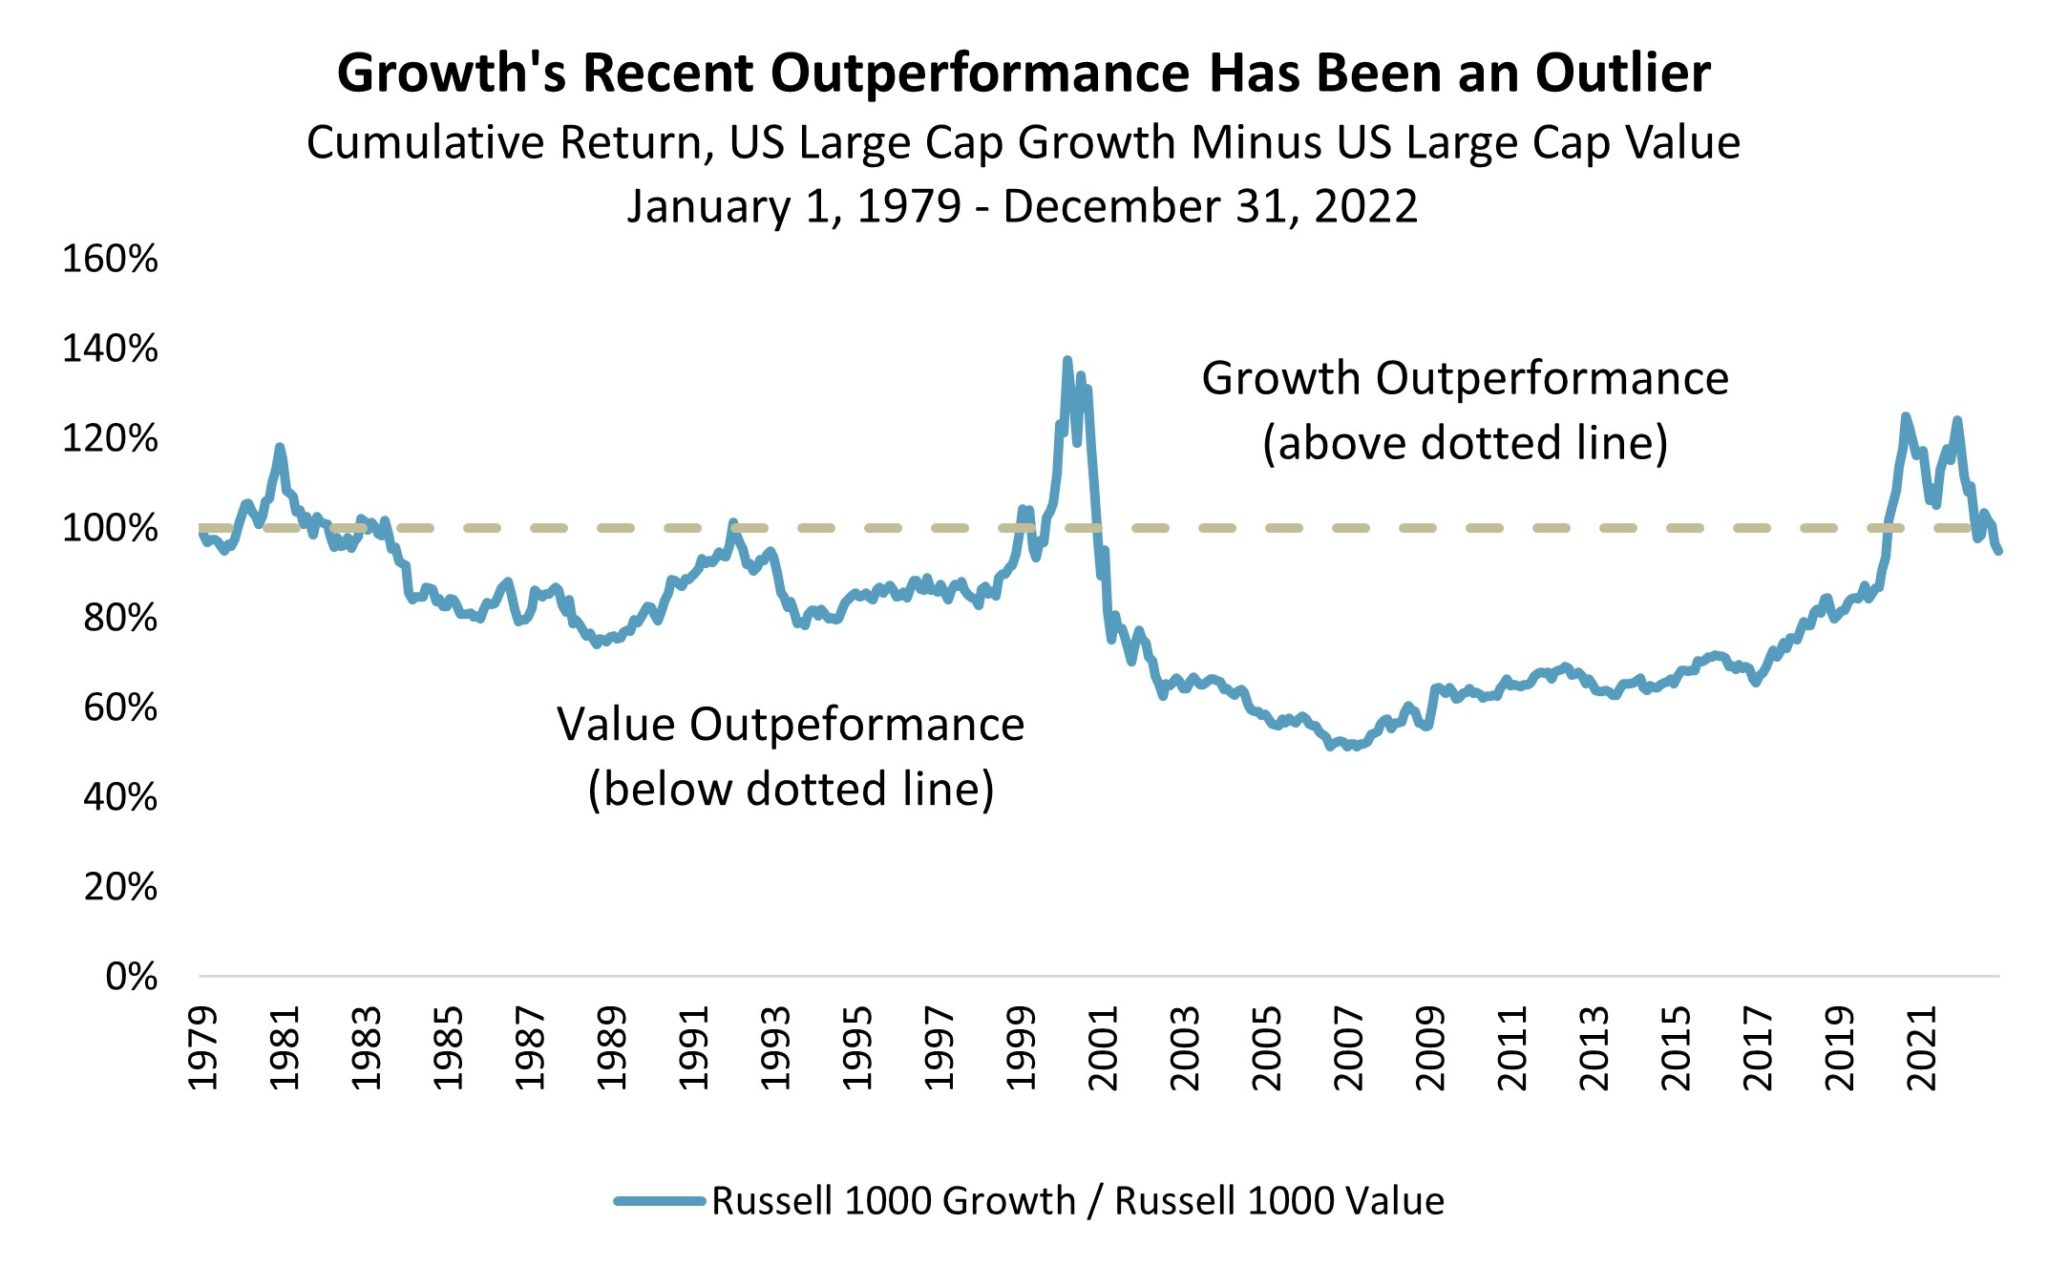
Source: FTSE Russell, Sellwood
Small Cap
Small cap stocks have the potential to offer returns above and beyond those of large cap stocks. This remains true even when considering the valuation premium investors have recently been willing to pay for the largest public companies in the US stock market. While historically, large- and small-cap companies have traded at similar price-to-earnings multiples, investor preferences for the largest (especially technology) companies have recently pushed their valuations to historic highs. To quantify this: the only time in the last 45 years that large-cap stocks have traded at a higher multiple of small-cap stock valuations was in the 1999-2000 market bubble.

Source: FTSE Russell, Sellwood
Furthermore, small cap stocks have shown resiliency in previous periods of high inflation, such as the 1970s. This, combined with their heavier weightings in cyclical industries, which tend to have pricing power in inflationary environments, suggests that small cap stocks have potential to outperform large-cap stocks as the next market narratives are written.
Non-US Stocks
It’s a big world out there, and about 40% of global investable public company value is listed outside the US stock exchanges. Still, the last decade has been a very challenging one for US-based investors to hold non-US investments, because of the US dollar’s unprecedented strength. Following many years of appreciation, the dollar reached 20-year high versus other global currencies in 2022. Going back to 1973, the inception of reliable data, the US dollar was only higher than its current level twice: during the 1999-2000 market bubble, and in the mid-1980s when interest rates peaked.
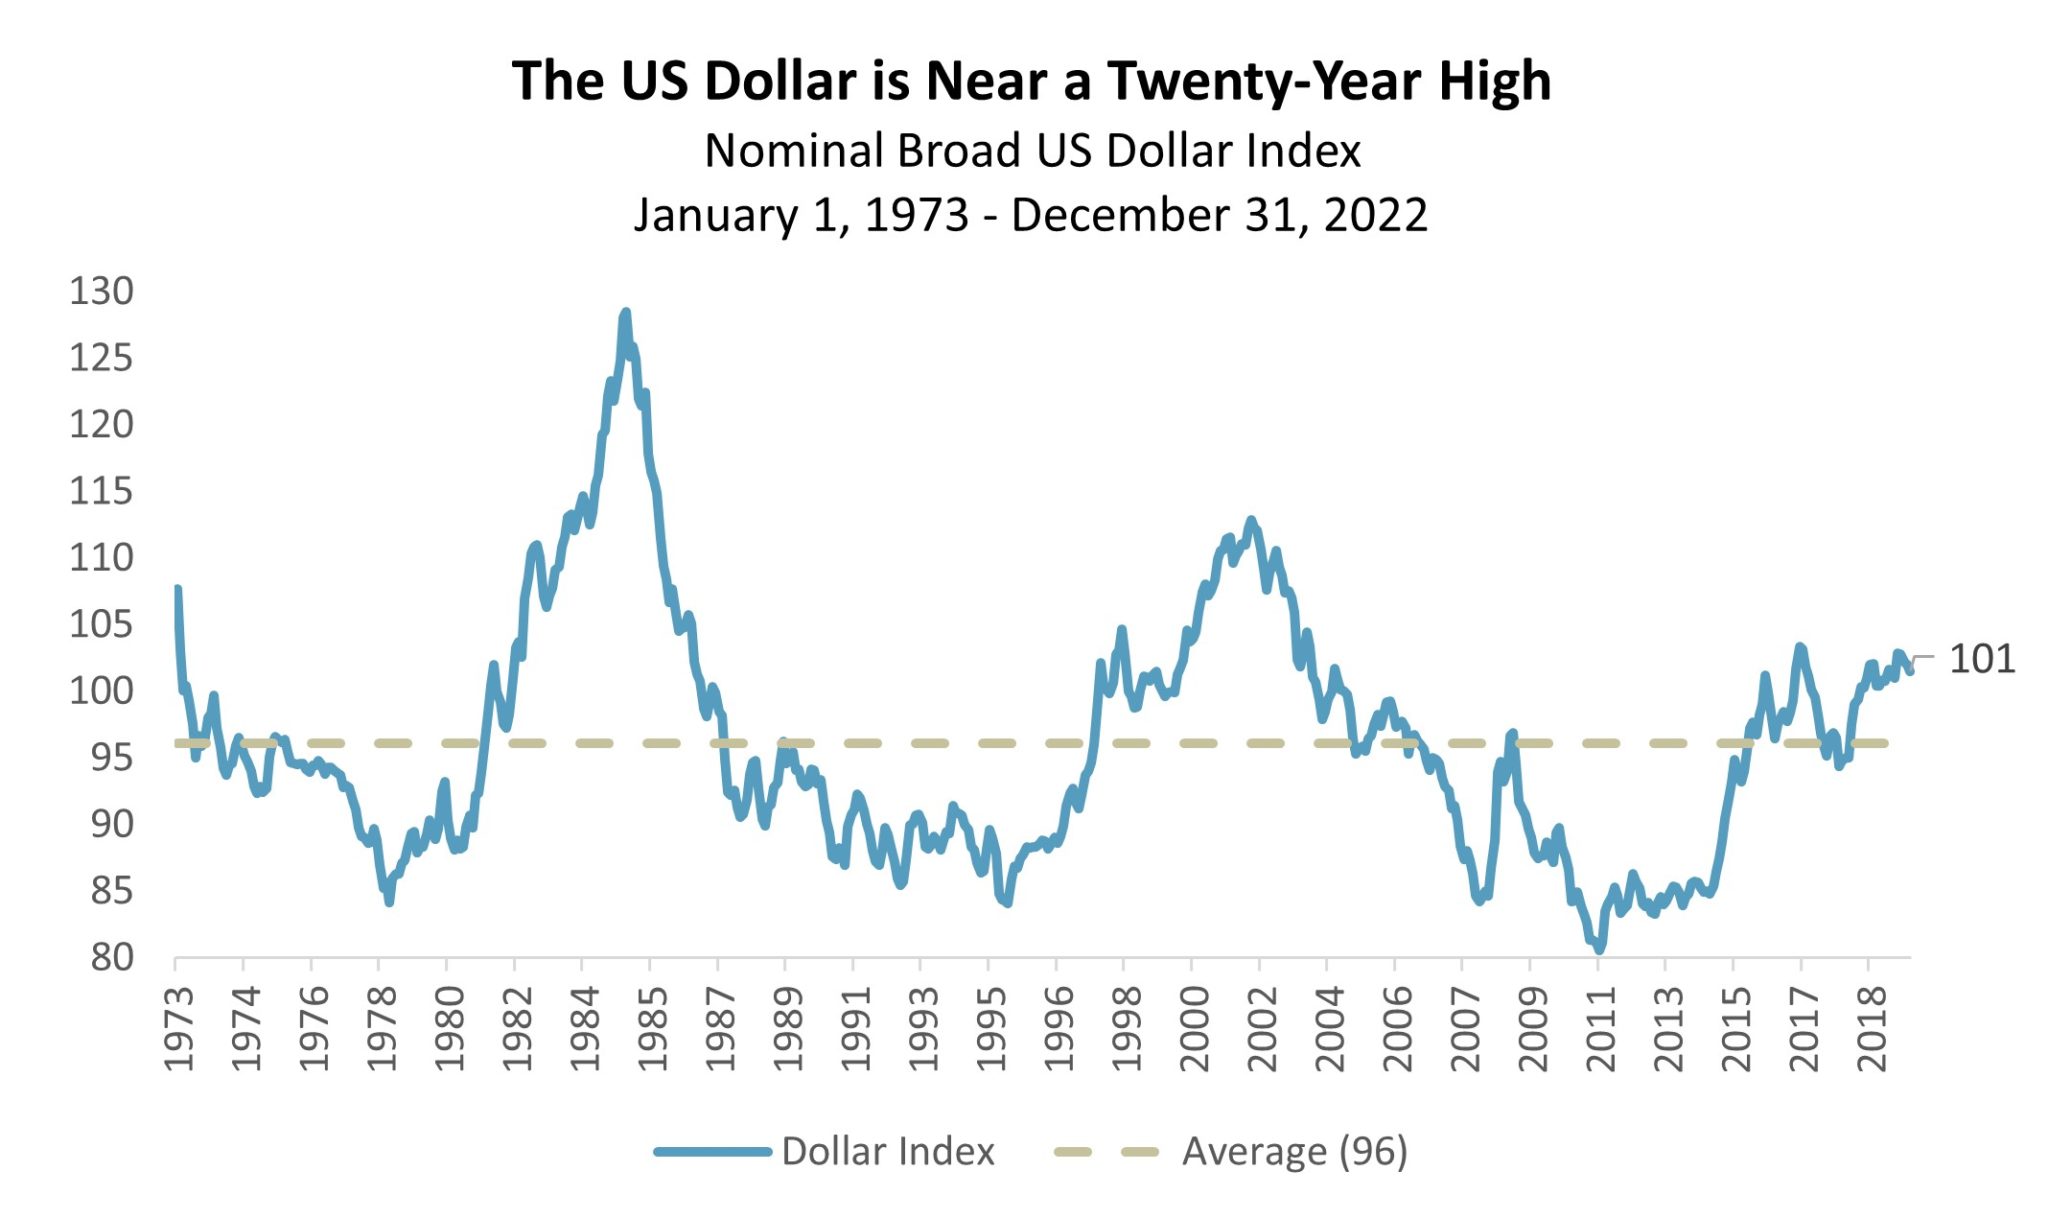
Source: Intercontinental Exchange, Inc., Sellwood
From the depths of the Global Financial Crisis until the dollar’s 2022 peak, the dollar appreciated by 50%.[4] This dramatic appreciation in the currency directly subtracted 50% from the returns of investments outside the United States. Going forward, we do not expect the same headwind, and that non-US investments should be able to stand on their own (local) merit.
The currency effect has coincided with a reduction in valuations for non-US stocks. While economic uncertainty reigns around the globe, we believe that (a) lower valuations offer a higher margin of safety for accepting the risk that comes such uncertainty, and (b) the economic picture is murky in the United States as well, only without such low valuations to compensate for it. Over the last 20 years, non-US stocks have traded at an average valuation discount of 14% compared to US stocks; that discount is currently 28% — double the average.
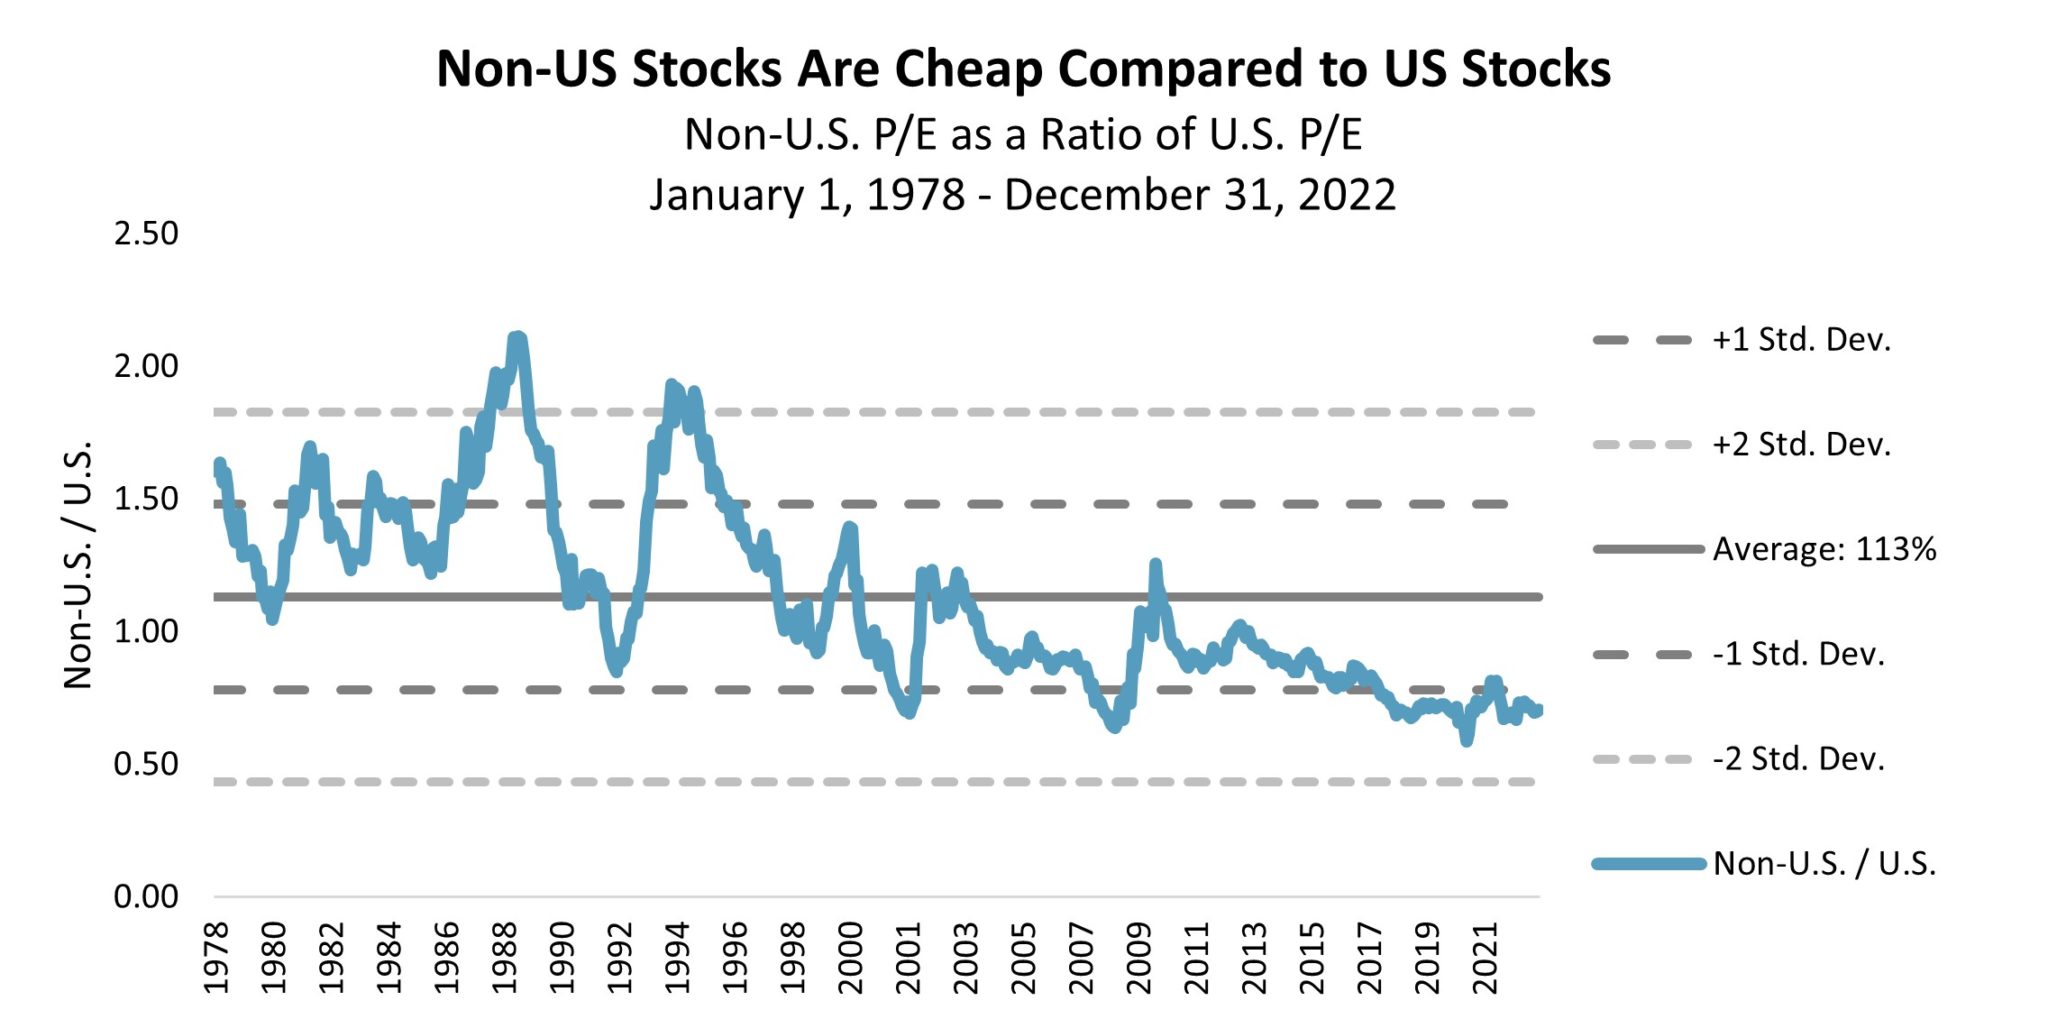
Source: MSCI, Sellwood
Bonds
US investment-grade bonds suffered their worst year on record in 2022. After such a year, they also represent a much better bargain than they did a year ago. In another example of narratives being unwritten, it is no longer true that bonds – currently yielding 4% — must be crowded out of portfolios that seek reasonable return. This has not been true since the 2008 Global Financial Crisis.

Source: Federal Reserve Bank of St. Louis, Sellwood
The expected return for a bond, or an index of bonds, over its maturity horizon is very close to the yield at which it was purchased. An expected return of 4% or greater for bonds implies a greater role for high-quality bonds in portfolios with fixed return needs. This actually makes an asset allocator’s job harder, as bonds, after 13 years, finally offer competition for riskier assets in portfolios that require meaningful return.

Source: Federal Reserve Bank of St. Louis, Morningstar, Sellwood
This challenge is exacerbated by the yield curve, which is currently flat (in fact, slightly inverted). A flat or inverted yield curve implies that the historic relationship between bond duration and return (the longer the bond duration or maturity, the higher the return) cannot necessarily be expected going forward. The current shape of the yield curve, all else equal, weakens the case for duration.
Correlations
The uncertainty of stock/bond correlations introduced in 2022 also complicates the case for duration. While over the last 20 years correlations between stocks and bonds have been negative – implying strong diversification benefit to holding both – the correlation sign flipped to positive in 2022. Whether “the norm” for stock bond correlations looks like the two decades from 2000-2021 (negative correlations), or like the several decades that preceded the turn of the millennium (positive correlations) is very much an open question. Because of its implications for diversification itself, we believe it is the most interesting question in markets today.

Source: Morningstar, Sellwood
At the same time, we have always believed that bonds should be evaluated not as standalone assets but rather in what they contribute to whole portfolios. Correlations do not need to be negative, just imperfect, to benefit portfolios.
Despite lower expected return, long-term, very high-quality bonds (like long Treasurys) have historically represented unique destinations in flight-to-quality markets (which are those when investors with stock-heavy portfolios need their bonds to perform most). Additionally, in the unlikely but devastating scenario of malign and prolonged deflation, there would be no substitute for them. As such, even despite a flat yield curve, we still believe that long Treasury bonds play an important role in diversified – especially equity-heavy – portfolios.
Spread Sectors
The market’s change of narrative, and the reshuffling of risk premia across assets, is not broadly evident in riskier areas of the bond market. At the end of 2022, we saw greater yields across bond market sectors than we have since the Global Financial Crisis. However, fixed income spreads, or the additional compensation for taking incremental risks in fixed income, are close to or below long-term historical averages. This implies more limited opportunity for active bond managers compared to prior periods of recessionary fear, when spreads widened more significantly.
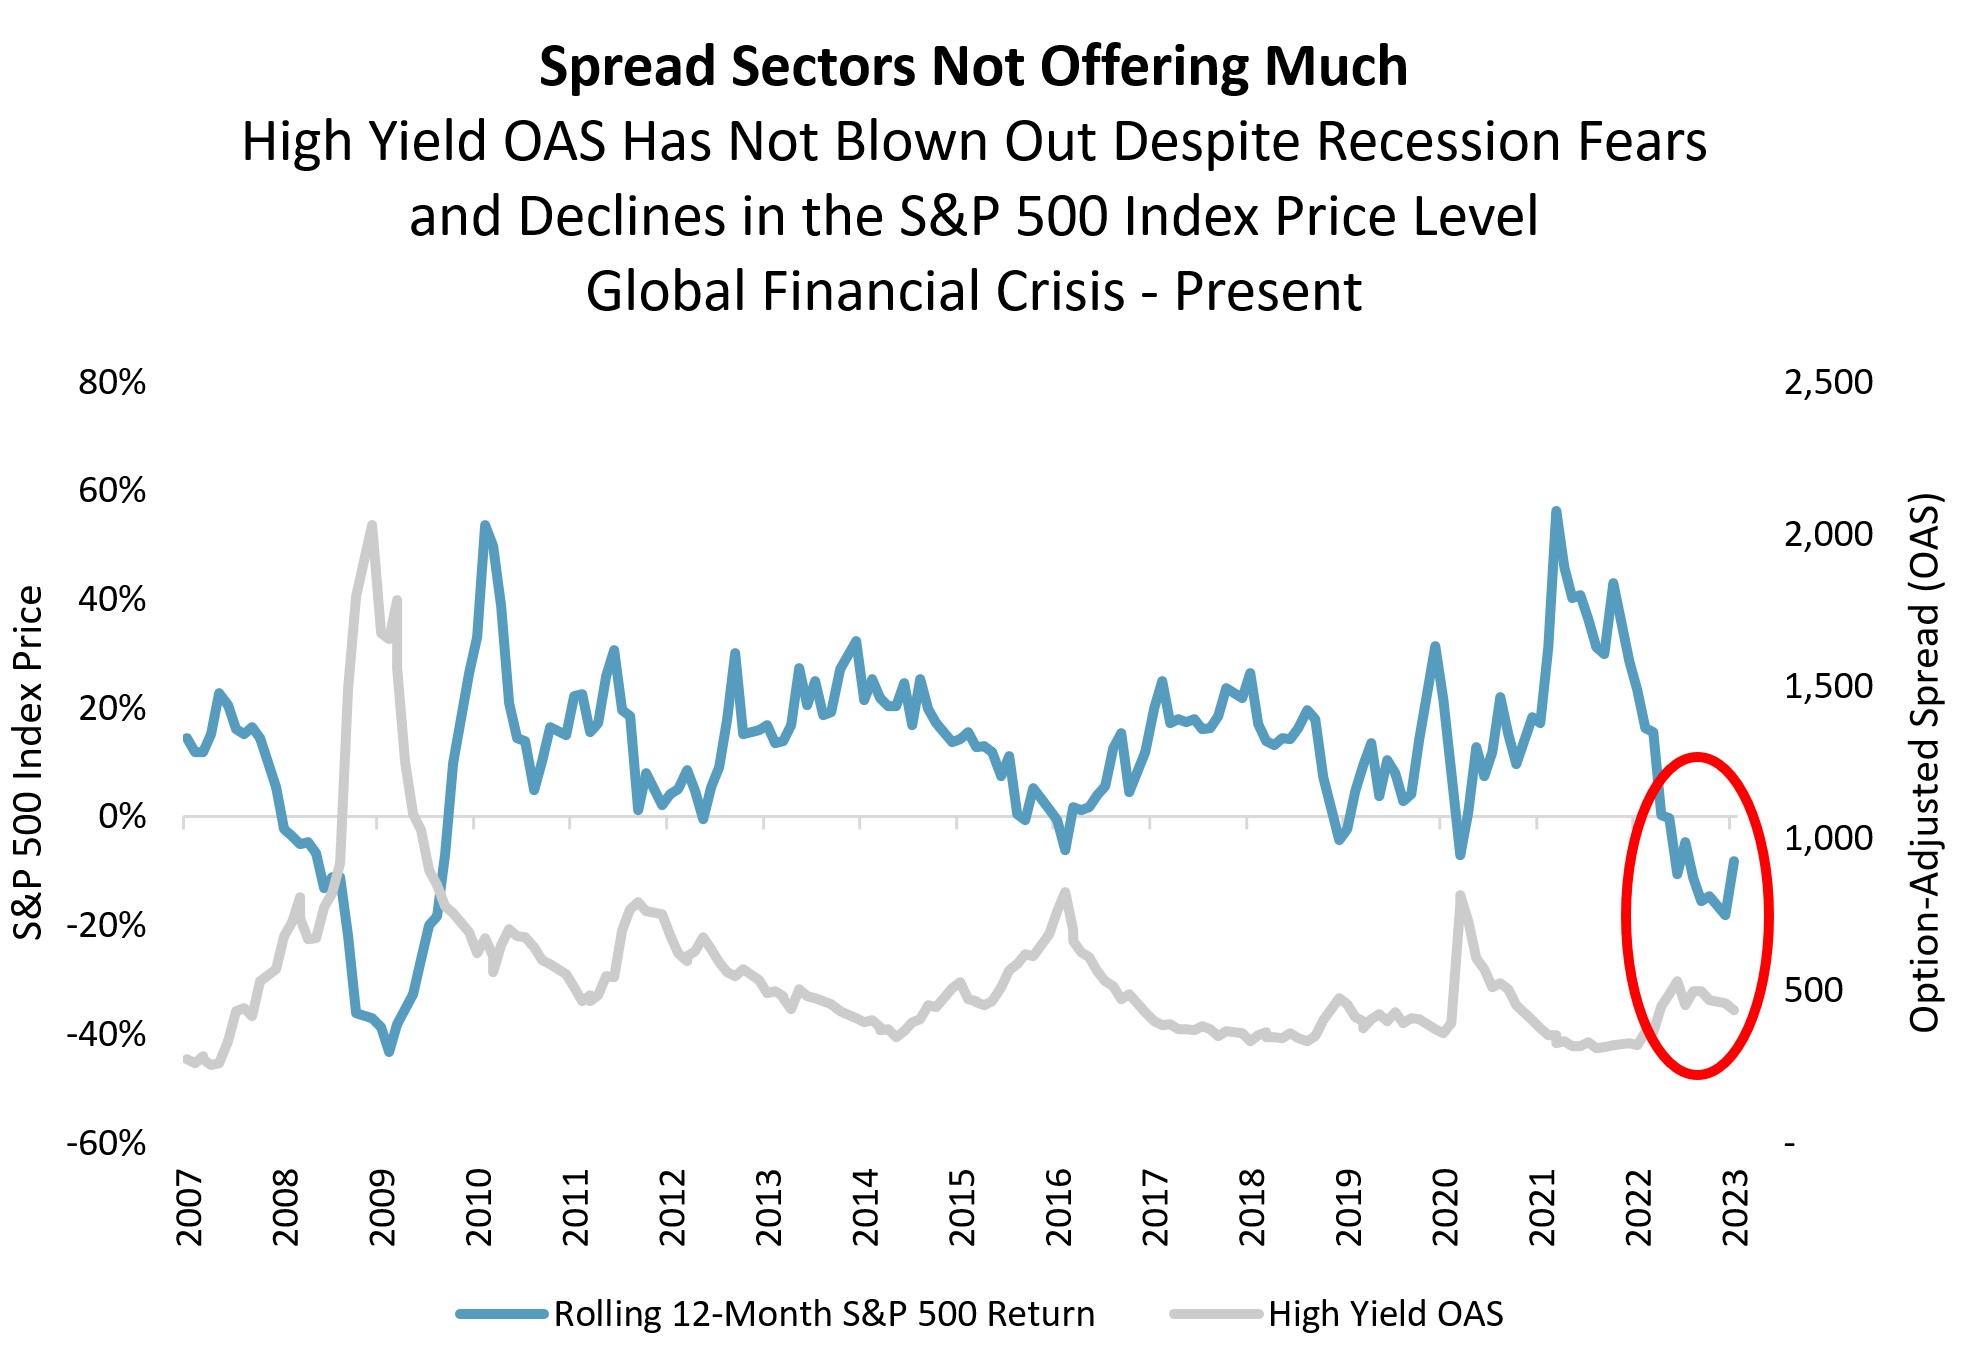
Source: Federal Reserve Bank of St. Louis, Standard & Poors, Sellwood

Source: Morningstar, Sellwood
Alternatives
The “low return environment” narrative that prevailed post-GFC was the mother of hundreds of new alternatives funds. Most of them failed, and most of the survivors remain unattractive and overpriced.
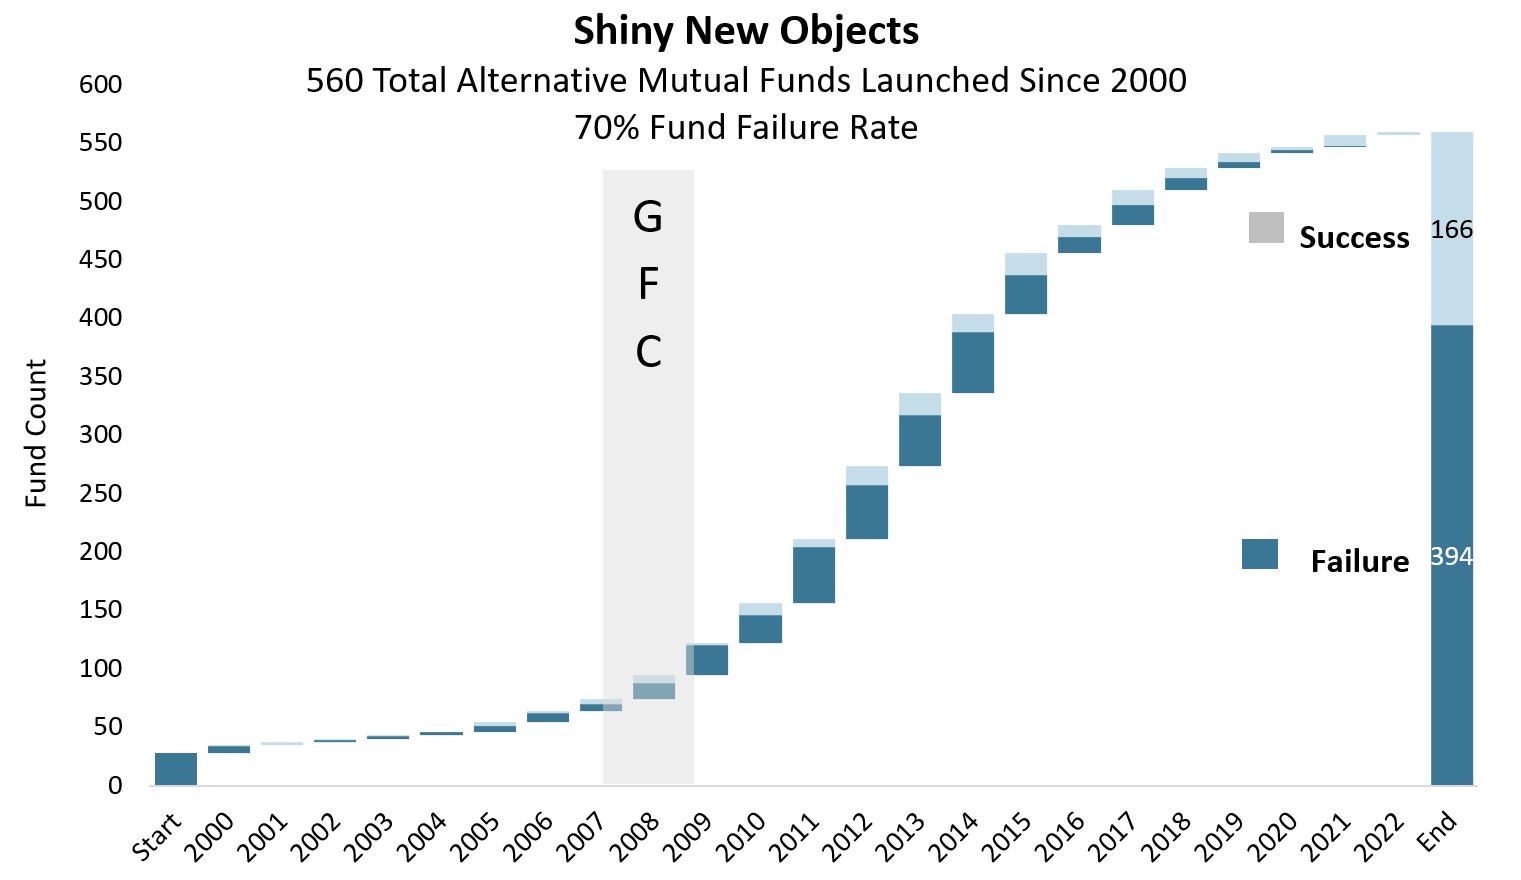
Source: Morningstar, Sellwood
The case for alternative assets, as a category, is weaker now that stocks and bonds (traditional assets) are priced to deliver higher expected returns. Over the last 13 years, when investment-grade bonds yielded an average of 2.4%, any portfolio with a fixed return objective above 5% (for example) could afford only a bare minimum allocation to bonds. In a very literal sense, every dollar allocated to bonds made achieving that return objective less likely. Today, when investment-grade bonds are yielding 4%, we expect that fewer allocators will be searching for “bond replacements” as in the post-GFC period.
At the same time, if stock/bond correlations cannot be counted on to be negative, the case for truly diversifying assets (with low or even negative return correlations to traditional stocks and bonds) is stronger. While they remain a tiny subset of the overall universe of alternatives, our research is focusing on those funds that improve portfolios via low correlations to stocks and bonds. Even in a world where stocks and bonds offer acceptable returns, a lower-returning asset with imperfect correlation to those assets can still improve a portfolio.
An important caveat: investors should be careful not to be fooled into believing that stale prices diversify portfolios. We believe that many investors are due for a rude awakening in 2023 when they realize that the funds that “preserved value” in 2022 simply were not marked with market prices. We are always mindful that investments with non-market-based valuations may appear to diversify portfolios without actually doing so.
In Summary
As much as 2022 witnessed the dismantling of asset valuations, the crumbling of longstanding market narratives that had supported those valuations was equally impressive. 2022 offered a reset, taking both stock and bond valuations back to more historically normal levels, and exposing most alternative assets as less “alternative” than many investors thought.
Considering the opportunities presented by this market reset, we suggest the following themes as potentially rewarding to long-term investors:
- Value, as a style, has suffered from narratives that prevailed over the last decade about technology overtaking the rest of the economy. We believe that this narrative was overwrought, and that value is potentially in the early innings of outperformance.
- Small Cap stocks have higher potential returns and lower valuations compared to large cap stocks. They have shown resiliency during past high inflation periods and are heavily weighted in cyclical industries, suggesting an ability to more rapidly adjust prices in an uncertain inflation environment.
- Post-GFC, a narrative took hold that the United States was “the cleanest dirty shirt” in the world, economically. This manifested in higher valuation premiums being applied to US corporate earnings, lower valuations outside the US, and a strengthening US dollar. We believe that this narrative will be difficult to sustain, and that currency markets are self-correcting in the long run. All of this favors continued allocation, and even higher allocation, to non-US stocks.
- Bonds finally offer enough yield to justify inclusion in return-seeking portfolios. The “There is No Alternative” narrative has crumbled as rising rates now offer more historically normal compensation to bondholders. At the same time, the diversification case for traditional high-quality bonds may have weakened as the 20-year pattern of negative stock/bond correlations broke down in 2022.
- Interestingly, spread sectors in the bond market have not repriced as they have in past similar stock markets. The fear evident in stock prices has not translated to riskier corners of the bond market.
- We believe that most of the narratives sustaining alternative investments were always false, but 2022’s market reset has weakened their case for inclusion in portfolios. Rare exceptions include those alternatives that benefit portfolios through (true, market-based) correlations.
[1] Niels Bohr
[2] Russell 3000 Index.
[3] Russell 3000 Value and Russell 3000 Growth.
[4] July 15, 2008 – September 27, 2022.
[5] Source: JP Morgan Guide to the Markets. As of 12/31/2022. Indexes: S&P 500 and MSCI ACWI ex US.