
“The greatest scientists are artists as well.”
-- Albert Einstein
Two questions:
- When was the US Equity market riskier for an investor:
- March 2009. The S&P 500 has just fallen 55% from its peak and the trailing ten-year standard deviation of S&P 500 returns was 21%. The market trades at a valuation of 13 times trailing 10-year normalized real earnings. Or…
- March 2019. A decade later. The S&P 500 has just experienced a 10-year, relatively uninterrupted bull market in which it cumulatively returned 415% without declining 20% along the way. The index’s trailing ten-year standard deviation of returns has been 15%. The market trades at a valuation of 30 times trailing 10-year normalized real earnings.
- At what point in time – March 2009 or March 2019 – would most risk models say that the equity market was riskier?
A Tale of Two Markets
Early 2009 was a fascinating time to evaluate risk. Just about all information available to an investor suggested that the US equity market was riskier than normal. Historical measured risk was higher than average, the market had gone nowhere but down in recent memory, and every sensory input suggested “sell.” But at the same time, valuations were low, and long-term investors can afford to tune out the noise.
Early 2019 is an equally interesting time to model risk. On one hand, following one of the longest bull markets in history, after which prices have accelerated faster than fundamentals, it would seem that the market would be more, not less, risky than in 2009. Higher valuations represent higher risk, all else equal. They leave less room for error. But on the other hand, any model that calculates risk (defined as standard deviation) looking back ten years will, for the first time in a decade, not include the experience of 2008. Any such model will likely understate risk, relative to reality.
One of these market environments appeared riskier than the other; the other actually was riskier than the other.
Looking forward, is an experience resembling 2008 less likely simply because it happened eleven years ago now, rather than ten years ago? Of course not. Behavioral science (specifically, the availability heuristic) suggests that human beings would tend to think so. This is why we invent quantitative models — to help our human brains evaluate hard questions with better context. The problem is: in March 2019, any quantitative model with a ten-year lookback period would have suddenly “forgotten” about 2008. Without adjustment, the model would fall victim to the same inaccurate analysis that imperfect human beings do, as the last salient market event recedes into the past.
You Can’t Model Risk with a Formula
Careful readers of our 2019 Capital Market Assumptions may notice that this year, the “qualitative adjustments” we made to the expected risk (standard deviation) of several asset classes were higher than they have been in the past.
When we calculate a forward-looking risk assumption for each asset class, we model the “risk” by calculating an average of the asset class’s standard deviation of returns over the last ten years, and over the longest period for which we have reasonable data.
As an example, this simple approach would calculate a “risk” for US Equity (the standard deviation of the Russell 3000 Index) of 14.7%, as of the end of 2018. That index, in the last ten years, experienced a standard deviation of its returns of 12.4%. Over the longest time period we can examine, the index experienced a standard deviation of its returns of 17.1%. Averaging these two numbers yields 14.7%.
This risk number, 14.7%, quantifies how uncertain we are about future annual returns. Using our expected annual return for US equity (6.9%, in arithmetic terms) and a standard deviation of returns of 14.7%, our assumptions imply that returns in any future year worse than -22.5% (a “two-standard-deviation event”) would be extremely unlikely, and a return worse than -37.2% (a “three-standard-deviation-event”) would be nearly impossible.
We can draw a bell-shaped curve depicting these parameters. Everything under the curve is possible under the assumed distribution of returns. Real-world events should not fall to the left or the right of the curve – outside the realm of “possible” under our assumptions.
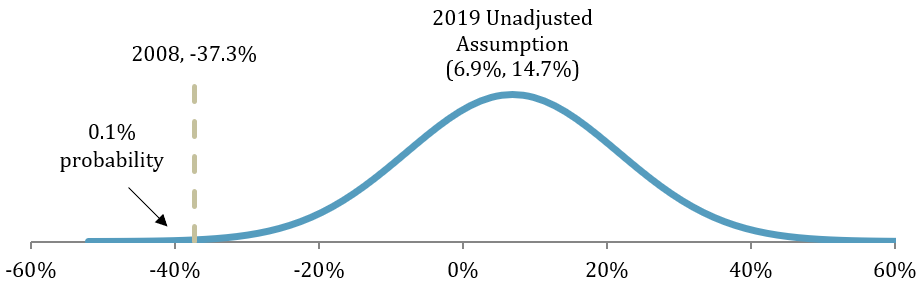
In the real world, it was only eleven years ago that we saw the US equity market decline by 37.3% in a single calendar year. Assuming market risk as calculated above would imply only a 0.1% chance of the 2008 experience happening. It would be saying that 2008’s real world decline should happen only once every 700 hundred years. This would be non-sensical. The US stock market, after all, has only existed for 201 years, and declines worse than -37% have actually happened in three of the last hundred years (in 1931, 1937, and 2008).
This is a problem. Nobody should forecast a level of risk that implies that something that has happened three times in the last 100 years should only happen once every 700 years. When the model tells you something that actually happened couldn’t have happened, it’s not reality that’s wrong; it’s the model.
Our process for designing risk assumptions solves this problem by forcing the model to adapt to actual observed reality. Rather than blindly accepting the output of a calculation, we have always applied a “qualitative adjustment,” upwardly adjusting the assumed risk until the actual worst-case scenario we have experienced, in the modern real world, had at least a 1% chance of happening, and has at least a 1% chance of happening again in the future. This implies that the worst-case scenario for a market, usually 2008, was a one-in-a-100-year event.
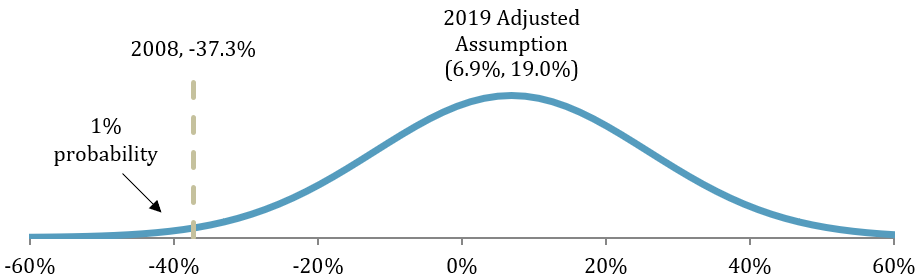
To recap, a naïve assumption of the US equity market’s risk, based on calculations of past returns, would yield an expected risk of about 15% and imply that 2008’s experience had a 0.1% chance of occurring. By focusing on real-world downside, and by making a reasonable assumption that 2008 was a one-in-a hundred-year event, we update our risk assumption to better reflect the real world. By increasing the risk assumption by 4.3 percentage points, we increase the validity of our risk assumption – the likelihood of 2008 happening inside of it – a hundredfold.
Still, a 4.3-percentage-point adjustment to the expected risk of a major asset class is unusual for us. It reflects the uniqueness of where we sit today, in early 2019. For the first time in a long time, a major market correction is so far in the rear-view mirror that it doesn’t show up in traditional models.
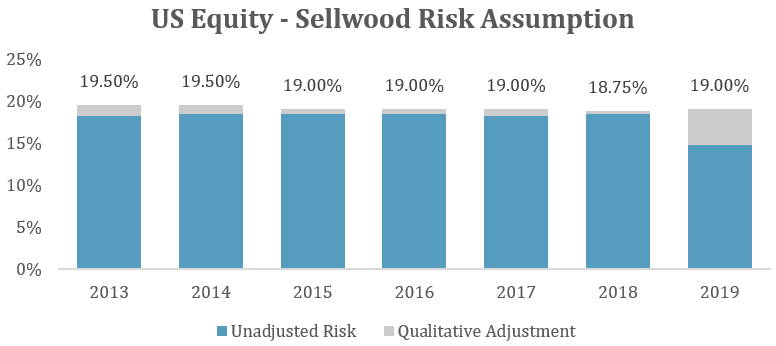
A year ago, under Sellwood’s 2018 assumptions, half of the risk calculation — the last-ten-years half — included the 2008 market experience. Our calculated risk for US Equity was 18.44%, making the real-world worst-case experience reasonably likely without adjustment.
But as the calendar turned into 2019, the 2008 experience fell off the calculation, and the calculated risk went down. Therefore, a higher adjustment was necessary to bring our assumed risk high enough such that a worst case in the real world is reasonably likely under our assumption set.
If we did not make this qualitative adjustment, our assumptions would tell an unlikely story: that at the tail end of one of the longest bull markets in history, risk has gone down, not up; and that the experience we all lived through just eleven years ago was so unlikely that it won’t happen ever again — not only in our lifetimes, but those of our children and grandchildren as well. We are uncomfortable designing an assumption set that makes these assumptions.
Conclusions
”Risk” is ephemeral, and not easily calculated. Nobody knows what the actual risk of an asset or asset class is. All anybody can do is guess, typically by examining what the past has delivered. Of course, we aren’t designing portfolios for the past; the ultimate goal is to develop reasonable expectations about what the future will deliver. Examining the past is of limited help in meeting this goal.
Our assumptions change as markets do, but the way we construct them includes guardrails to ensure that market anomalies or recent experience won’t contort the assumptions into saying the impossible.
To do otherwise is to surrender judgment to a formula.
Good investors know something that bad investors don’t: that it is often when things appear bleakest that prospects are brightest, and that when things look riskiest that they are safest. Models can help reinforce this truism, but only if the models are intelligently designed, blending art and science. Otherwise, using the models isn’t any more helpful than asking a bad investor for investment advice.