
This past March marked the 10-year anniversary of the market bottom that concluded the 2008/2009 Global Financial Crisis. The decade ending March 31, 2019 was a very interesting one for market observers and practitioners. We offer ten market observations from that decade, and, informed by history, ten predictions about what the next ten years may hold.
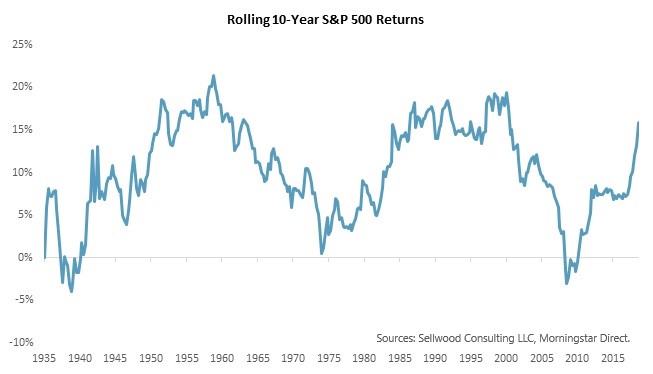
1. The US stock market rose 338%, or 16% a year, on average, rising in 9 of 10 years.
The US stock market has experienced a fantastic bull market over the last decade. The market’s last ten years were better than 80% of ten-year periods in its own history.
Prediction: This performance could be repeated, but it would be unlikely.
The last 10 years immediately followed the spectacular collapse of both the economy and stock market in 2008 and early 2009. Low valuations at the time provided a springboard for future returns that simply does not exist today. A decade ago, the market traded at a valuation of 13 times trailing 10-year real earnings; that ratio is 30 today.
At the same time, multi-decade periods of even higher return persisted after the Second World War, and throughout the economic expansion of the 1980s and 1990s. One out of every five decades in history has experienced higher returns than those we have just witnessed. An unusually strong and sustained economic expansion might justify current high valuations. On the other hand, it would take an unusually strong and sustained expansion to do so.
2. Non-US equity markets rose only about half what the US market did.
Over the last decade, the stock markets of the world outside the US collectively returned 145%, or about 9% per year. This was less than half of the US equity market’s return. Over the last five years, non-US equity markets have been up less than 3% per year, while US stocks have risen by about 11% per year.
Prediction: Odds are, this disparity won’t be repeated.
Over the long term, US and non-US equity markets have delivered similar returns to US-based investors. Over the longest period for which we have data, the US market has outperformed the rest of the world by 1.1% annually, on average, since 1970. While some US market participants would point to that gap as a testament to the superiority of the US market, the entirety of outperformance has occurred just since 2011. Prior to then, the historical data had shown long-term outperformance of international markets relative to the US market.
Part of the reason for this disparity has been the depreciation of foreign currencies relative to the US dollar since 2011, which has depressed returns to non-US investments (from the perspective of a US investor). Over the longest period for which we have data, it has been the US dollar that has depreciated, providing the opposite effect.
3. US high-quality bonds returned 3.8% per year.
On the back of a mostly declining interest-rate environment, US high-quality bonds earned 3.8% annually, lower than their long-term average of 7.3% since 1976 but still in-between cash and stocks.
Prediction: This will more or less be repeated.
We have written extensively about how future bond returns almost inescapably follow their current yield. The yield for high-quality US bonds today is about 3%. It will be very difficult for their annual return over the next decade to be very different from 3%.
At the same time, it is likely that high-quality bonds will turn in performance somewhere between cash and equities, in-line with their risk. Historically, they have performed this way in 86% of all ten-year periods.
4. Cash returned nearly nothing (0.3% per year).
The Federal Reserve held short-term rates at zero for the majority of the last decade. Consequently, cash didn’t do much better than zero.
Prediction: Cash will perform better in the next decade.
Currently, the Federal Reserve’s Federal Funds Rate is 2.4%. This is a reasonable proxy for what investors should expect from their cash holdings. High-quality US Treasury money market funds currently yield about that rate, less their fees.
5. Active managers disappointed.
According to S&P’s latest SPIVA study, more than 84% of US equity funds underperformed their benchmarks over the last decade. Small-cap and international equity funds did not perform much better, as a group. Measured year-over-year, the trend does not favor active managers.
Prediction: As a group, active managers will continue to disappoint.
As William Sharpe observed nearly 30 years ago, the market is a zero-sum game. “Properly measured, the average actively managed dollar must underperform the average passively managed dollar, net of costs. Empirical analyses that appear to refute this principle are guilty of improper measurement.” The market has become harder to beat, but active manager costs generally remain too high. Consequently, fewer managers can outperform, net of the fees they charge.
6. Hedge funds really disappointed.
Hedge funds, originally sold to investors as sources of high return with low risk, delivered the low risk but couldn’t provide the high return. Over the last decade, hedge funds underperformed US stocks, international stocks, public and private real estate, and even high-quality bonds.
Prediction: We are with Warren Buffett on this one: hedge funds will continue to disappoint.
Given their fee structures, hedge funds, at least as a group, have little hope of doing anything but disappoint their clients. There are simply too many dollars chasing too few opportunities for alpha, and fees remain at levels that are difficult to justify given the opportunity set. Our research shows that hedge fund managers appear capable of adding value with investor money – it’s just that they are equally talented at designing fee structures that keep all that value for themselves, leaving little behind for the client.
7. Value died.
Traditional value investing, as American as apple pie, has lagged significantly compared to investments in growth companies. Since April 1, 2009, US value stocks have returned 294% — an impressive number by itself, but still 110% below growth company stocks over the same time period. As of early 2019, value is in the longest drawdown relative to growth in history.
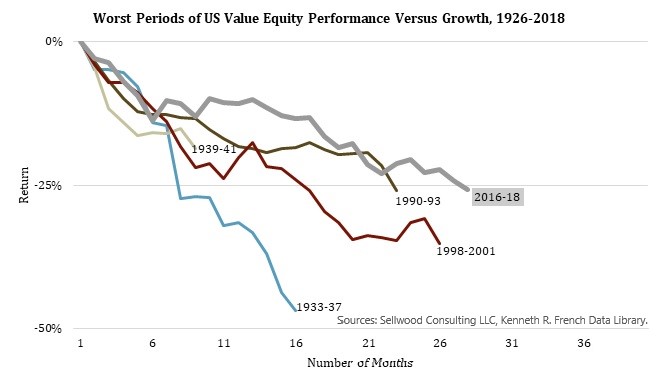
Prediction: Value is not dead, only asleep.
Hungry for growth in a slow-growth world, investors have bid up growing companies more than their slower-growing but more modestly valued counterparts. Prior to ten years ago, value had historically provided a premium to growth stocks, but not without significant periods of pain for investors. Since 1926, value has beaten growth in 80% of all trailing 10-year periods. Value has been a valuable proposition, just not in this last decade.
8. The “bond bubble” didn’t pop because it didn’t exist.
For all the worries of rising rates, long-term bonds handily outpaced their shorter-duration counterparts over the last decade. Long-term bonds returned 7.3% per year, while short-term bonds returned 2.2%.
Prediction: Investors will continue to be foiled attempting to time rate changes in the bond market.
All the predictions for rising rates were well founded, but the investment implications of those predictions were severely overblown. Since the Federal Reserve began raising rates in December of 2015, long-term bonds have returned almost 20% cumulatively while short-term bonds have returned just 6%. Investors who adjusted their bond portfolio composition to time rate changes suffered. Profiting from timing rate changes has proved nearly impossible, even with a Federal Reserve that has been transparent about its plans, and we don’t see why that should change anytime soon.
9. Noise and temptations for short-termism abound.
Quantitative Easing. Swine Flu. Zero Lower Bound. European Sovereign Debt Crisis. Dodd-Frank. Double-dip Recession. Operation Twist. Ebola. Zika. Detroit Bankruptcy. ISIS. US Government Shutdown. Brexit. President Trump. President Trump’s tweets.
None of these words or phrases existed, at least in common parlance, a decade ago. Each of them offered an opportunity to bail out on what would become the longest bull market in history.
Prediction: The noise will continue, but opportunities to avoid it remain the same.
It is said that markets climb a wall of worry. There will always be things to worry about. We advise clients to maintain a long-term perspective. Among other advantages, it confers the luxury of being able to tune out the noise and participate in market return.
10. Fears of high inflation were unfounded.
In addition to holding short-term interest rates near zero (Observation #4), the Federal Reserve also embarked on a “Quantitative Easing” program which saw the Federal Reserve’s Total Assets increase by almost 5 times (from $900 billion at the start of the financial crisis to a peak of $4.5 trillion in 2015). Quantitative Easing, which is intended to inject money into the economy, was thought to eventually lead to higher inflation as the economy grew. While the US economy has experienced one of the longest economic expansions in its history, inflation has remained stubbornly below the Federal Reserve’s target of 2%. The average Headline Consumer Price Index Year-over-Year change in the last decade has been just 1.6% – well below the long-term average of 3.5%. Although it is difficult to know the exact cause of low inflation, technology, productivity, and (the lack of) wage growth have likely all served to dampen it over the last decade.
Prediction: Inflation will remain as difficult to forecast as bond yields.
Economies are complex systems, and multiple variables affect indicators like the level of inflation. As tempting as it is to predict economic indicators, things like the experience of inflation over the last decade remind us that humility is an important part of an investment process.
* * * * *
Markets offer lessons to students who are patient listeners. Some lessons of the last decade are that crises end quickly, but fear subsides slowly; that changing conditions can introduce new, persistent market regimes; and that a “long-term” view of history is necessarily longer than 10 years.
Note: All returns are presented as of March 31, 2019, using common market indexes. Sources: Sellwood Consulting LLC, Morningstar Direct, Investment Metrics, eVestment, Federal Reserve Bank of St. Louis, and Kenneth R. French – Data Library